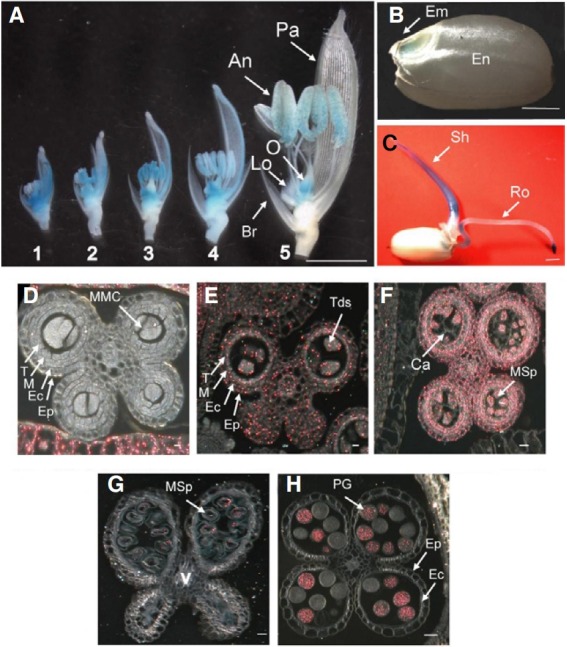
Fig. 2. Expression profiles of the OsImpβ1 gene using GUS assay. (A) Temporal and spatial expression patterns of the OsImpβ1-GUS gene fusion product in OsImpβ1/osimpβ1-1 spikelets at various developmental stages: Samples 1, pollen mother cell stage; 2, meiosis stage; 3, tetrad stage; 4, late vacuolated stage; 5, mature pollen stage. (B) Expression patterns in a mature seed. (C) Expression patterns in a seeding. Bar = 2 mm. Cross sections of anthers at pollen mother cell stage (D), meiosis stage (E), tetrad stage (F), late vacuolated stage (G), and mature pollen stage (H). Photographs were taken with dark-field microscope (D-H), where GUS activity appeared as red coloring. An, anther; Br, bract; Ca, callose; EC, endothecial cell layer; Em, embryo; En, endosperm; Ep, epidermal cell layer; Lo, lodicules; M, middle layer; MMC, microspore mother cells; MSp, microspores; O, ovary; Pa, palea; PG, pollen grain; Ro, root; Sh, shoot; T, tapetal cell layer; Tds, tetrads; V, vascular region. Bars = 40 μm.

