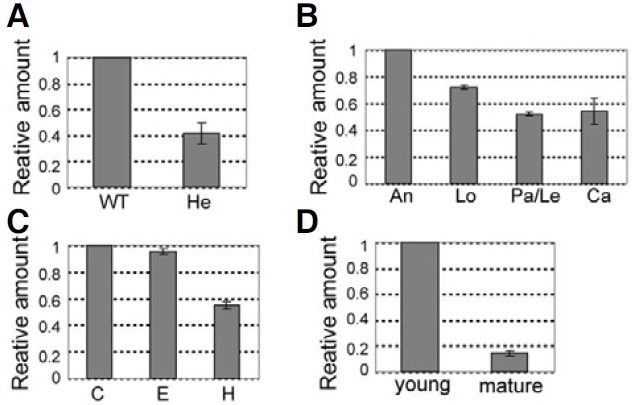
Fig. 3. Quantitative real-time RT-PCR analyses of OsImpβ1 expression. (A) Quantitative real-time RT-PCR analysis of OsImpβ1 in wild-type and hetero (OsImpβ1/ osimpβ1-1) anthers at mature pollen stage. (B) Spatial expression levels of OsImpβ1 in mature floral organs (C) Temporal expression patterns of OsImpβ1 in wild-type roots at 10 days after germination. (D)Temporal expression patterns of OsImpβ1 in wild-type palea/lemma at young and mature stages. An, anther; C, root cap; Ca, carpel; E, elongation zone; H, root hair zone; Le, lemma; Lo, lodicule; Pa, palea. The OsImpβ1 expression levels were normalized with respect to the internal control Ubiquitin 1(Os03g0221500, LOC_Os03g12140) gene. The gene expression levels were calculated by the delta Ct Method.

