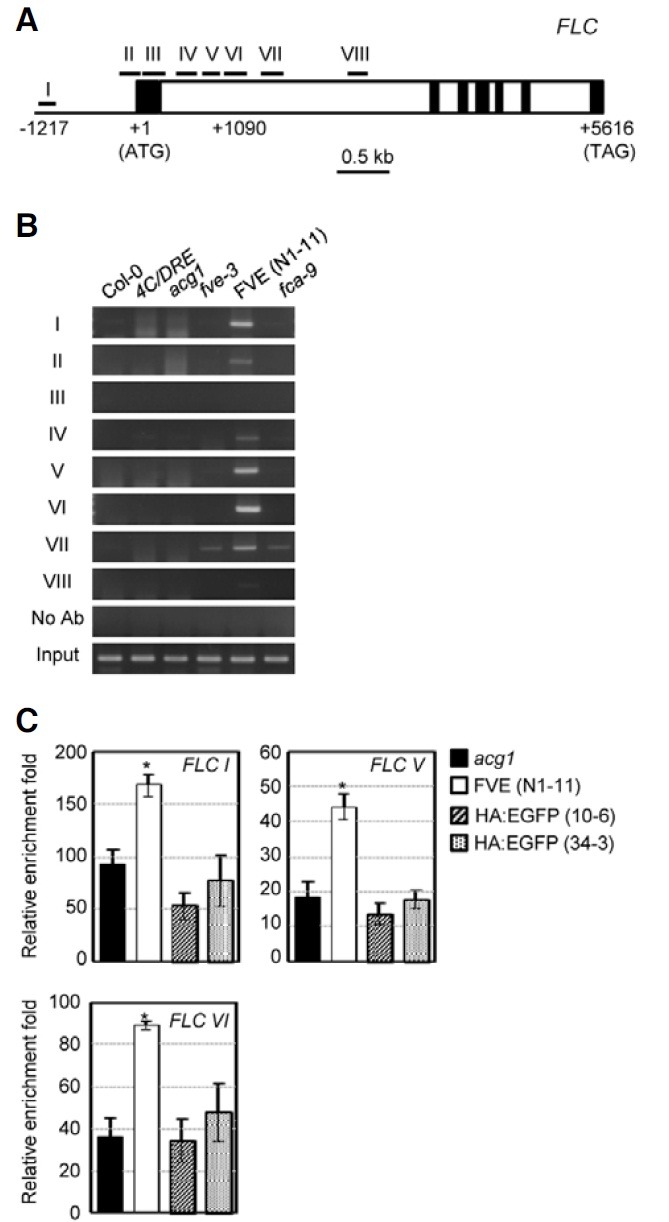
Fig. 2. ChIP analyses of the FLC chromatin in acg1 overexpressing HA:FLAG:FVE. (A) Schematic structure of the FLC region. I to VIII represent the regions in which FVE binding was evaluated by a ChIP. The translation initiation point is +1. The filled boxes represent exons and the open boxes represent introns. (B) ChIP analyses of FVE binding to the FLC chromatin. No Ab indicates ChIP carried out without antibody. The input is the chromatin prior to immunoprecipitation. ChIP analyses were carried out with three biological replicates; representative PCR data are shown. (C) Quantitative PCR analysis of FVE binding to the FLC chromatin compared with EGFP. Genomic DNA obtained by ChIP using HA antibody in acg1 plants overexpressing HA:FLAG:FVE or acg1, or HA:EGFP-overexpressing plants were analyzed by quantitative PCR. Values are expressed as the means of triplicate biological replications with error bars indicating standard errors. *denotes statistically significant changes with p < 0.05 compared with the acg1 control.

