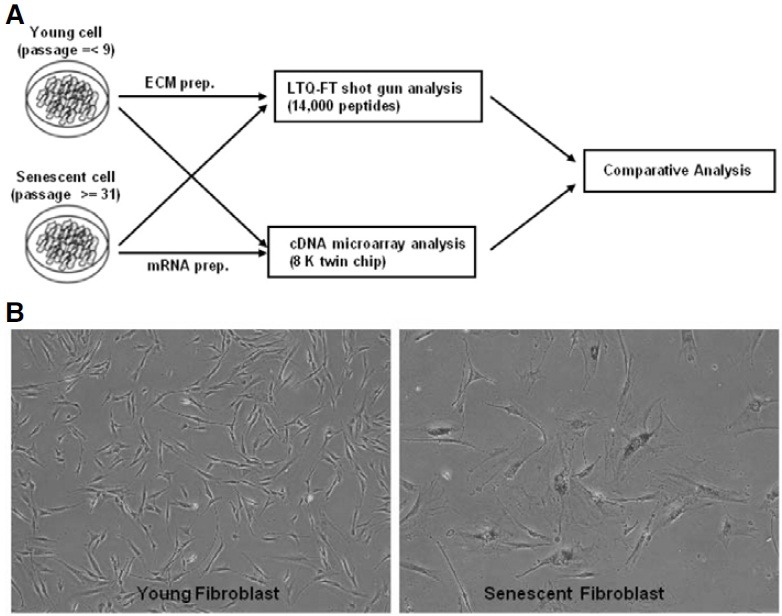
Fig. 1. Comparative analysis scheme. (A) Young cells at passage 9 or lower and senescent cells at passage 31 or higher were used. Total RNA was isolated, converted to cDNA, and then microarray analyses were performed using a DNA chip (8k human cDNA). Matrix proteins were prepared as described in “Materials and Methods”, and proteomic analysis were performed using LTQ-FT shotgun methods. (B) Young cells and senescent cells were stained for β-gal to detect senescent cells.