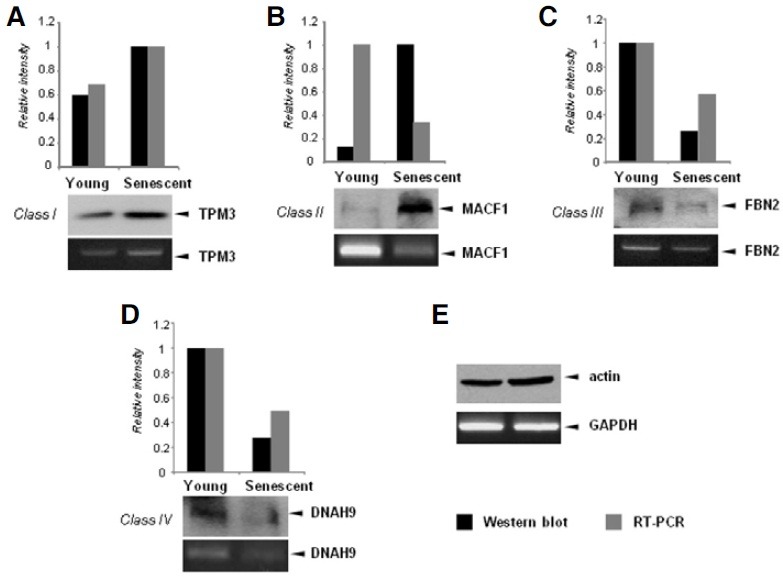
Fig. 4. Validation of comparative analysis results by Western blot and reverse transcription (RT)-PCR. (A) Expression of TPM3, a representative class I gene, was examined by Western blot analysis with an anti-TPM3 antibody (upper panel) and RT-PCR analysis (bottom panel). The density of the TPM3 band was quantitated and plotted on a bar graph. (B-D) Expression of MACF1 (class II gene), FBN2 (class III gene), and DNAH9 (class IV gene) were examined as described above. (E) β-actin protein was used as a loading control for Western blots and GAPDH was used as a normalization control for semi-quantitative PCR.