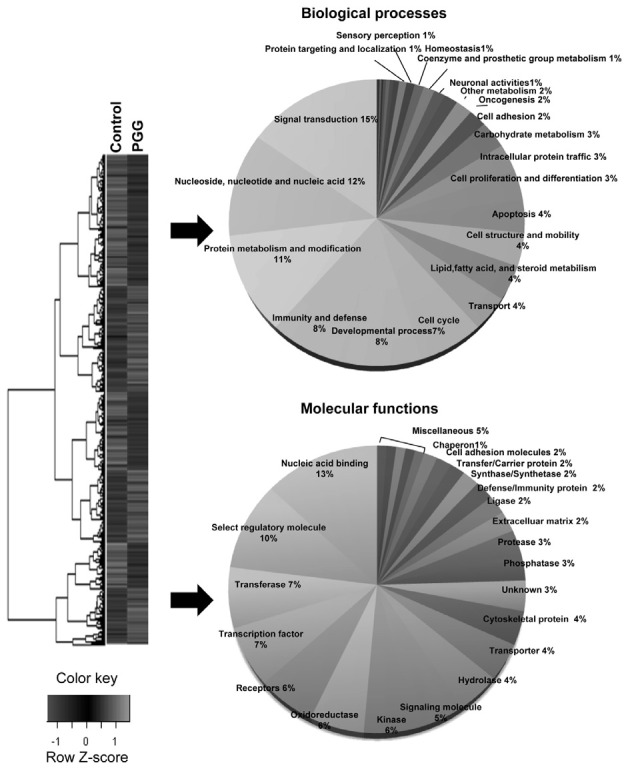
Fig. 3. Gene ontology assignment of differentially expressed genes. Clustergram of up- and down-regulated genes in MDA-MB-231 cells. Microarray data from control (untreated cells) and experimental groups (PGG-treated cells) were combined and clustered. There are three independent samples for each group. Each gene is represented by a single row of clustered boxes and each group is represented by a single column (left). Gene ontology classification based on biological processes and molecular functions (right).

