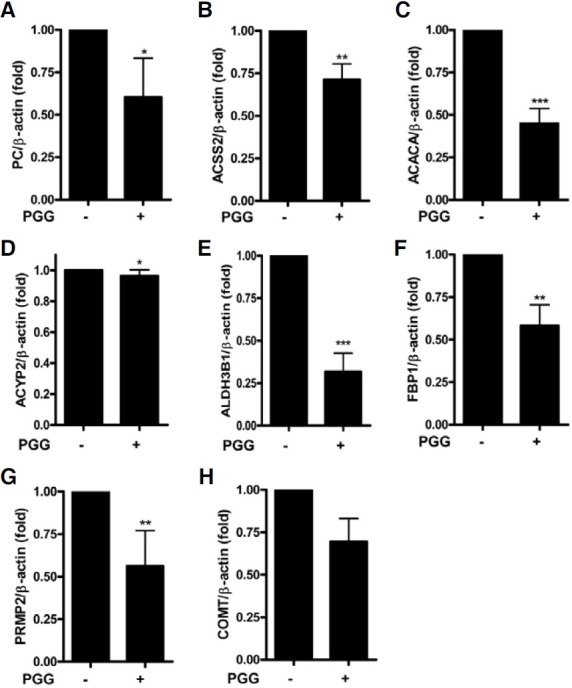
Fig. 4. Validation of gene expression by real-time RT-PCR in MDA-MB-231 cells. The results are normalized as a ratio of each specific mRNA signal to the β-actin (ACTB) gene signal within the same sample and the values expressed. (A) PC, (B) ACSS2, (C) ACACA, (D) ACYP2, (E) ALDH3B1, (F) FBP1, (G) PRMT2 and (H) COMT. Data were presented as means ± S.D. (n = 3). *p < 0.05, **p < 0.01 and ***p < 0.001 vs control.

