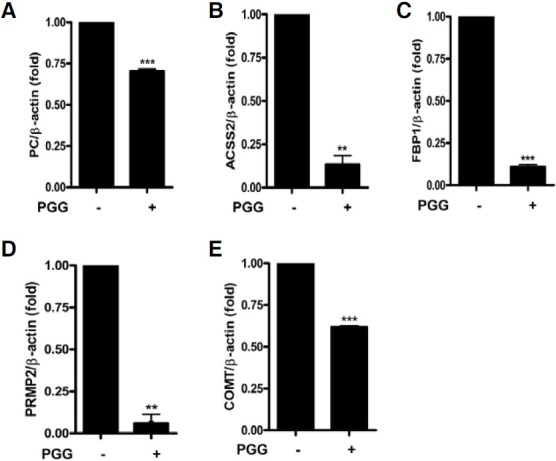
Fig. 5. Validation of gene expression by realtime RT-PCR in MCF-7 cells. The results are normalized as a ratio of each specific mRNA signal to the β-actin (ACTB) gene signal within the same sample and the values expressed. (A) PC, (B) ACSS2, (C) FBP1, (D) PRMT2 and (E) COMT. Data were presented as means ± S.D. (n = 3). **p < 0.01 and ***p < 0.001 vs control.

