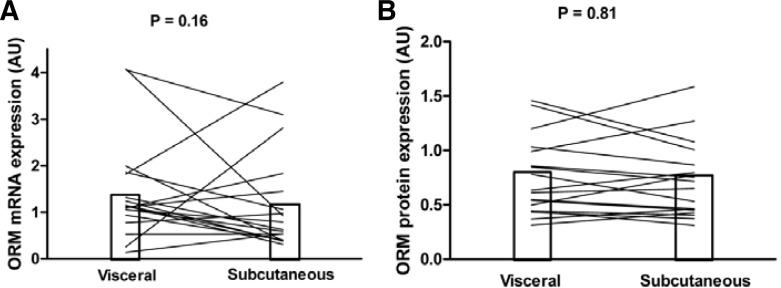
Fig. 2.
ORM mRNA expression and protein expression in human VAT and SAT. (A) Total RNA of paired samples from VAT and SAT was quantified using real-time PCR. Mean ORM mRNA expression was not significantly different between VAT and SAT (n = 20). (B) ORM protein expression of paired samples from VAT and SAT was analyzed by Western blot. Mean ORM protein expression was not significantly different between VAT and SAT (n = 18).

