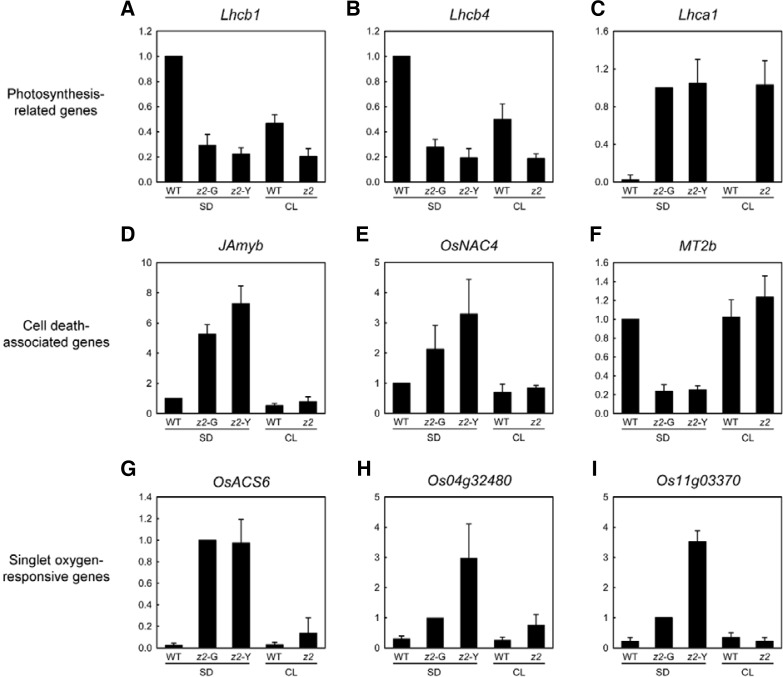
Fig. 6.
Expression analysis of WT and z2 leaves by qRT-PCR. (A–C) Expression levels of photosynthesis-related genes, Lhcb1 (Os01g41740), Lhcb4 (Os07g37240), and Lhca1 (Os06g21590). (D–F) Expression levels of cell death-related genes, JAmyb (Os11g45740), OsNAC4 (Os01g60020), and MT2b (Os05g02070). (G-I) Expression levels of 1O2-responsive genes, OsACS6 (Os04g48850; Fig. S5), Os04g32480, and Os11g03370. Relative mRNA levels were normalized to the transcript levels of glyceraldehyde phosphate dehydrogenase (GAPDH; GenBank accession number AK064960). The mean and SD values were obtained from more than nine biological replicates.

