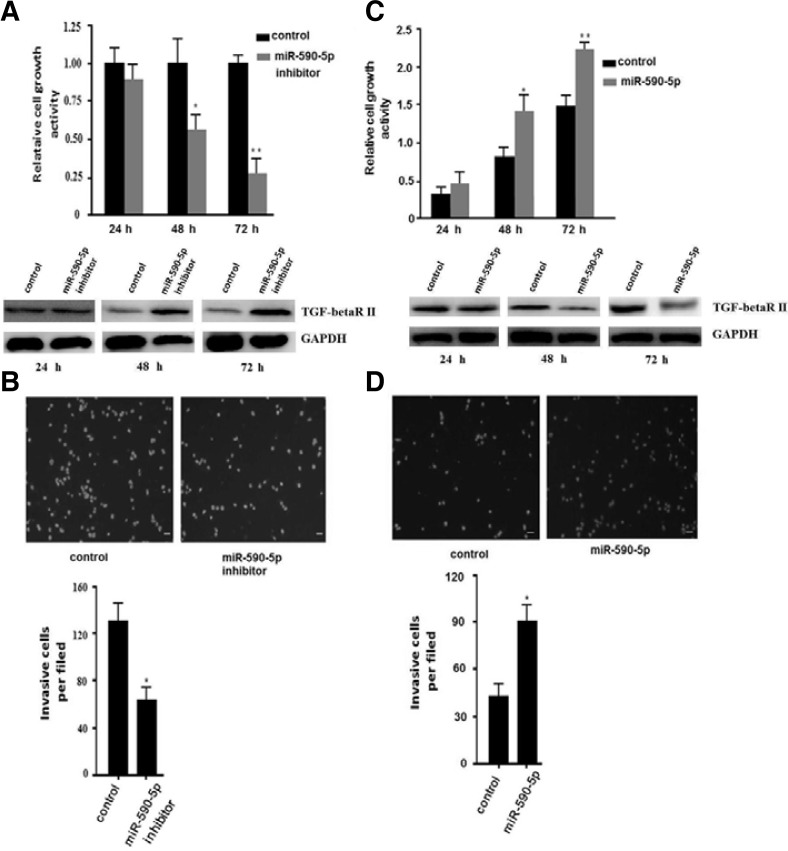
Fig. 3.
miR-590-5p regulates the proliferation and invasion of human HCCs. (A) Inhibition of miR-590-5p could inhibit the proliferation of HepG2 cells. An MTT assay was used to determine relative cellular proliferation at 24, 48, and 72 h. After transfection with miR-590-5p, the 48 h and 72 h data showed a statistically significant difference. All data are presented as means ± s.d. of three independent experiments. The change of protein level was detected by Western blot and is shown at the bottom. (B) Inhibition of miR-590-5p in HepG2 cells significantly inhibited cell invasion. HepG2 cells transfected with miR-590-5p inhibitor or negative inhibitor control. Representative images are shown at the top, and the quantification of three independent experiments is shown at the bottom. Representative photomicrographs of the membrane-associated cells assayed using hochest33342 staining (200×) are shown. All data are presented as means ± s.d. of three independent experiments. *p < 0.05, **p < 0.01. The change of protein level was detected by Western blot and is shown at the bottom. (A) L02 cells were transfected with miR-590-5p mimics or negative control. The MTT assay was used to determine relative cellular proliferation at 24, 48, and 72 h. All data are presented as means ± s.d. of three independent experiments. *p < 0.05, **p < 0.01. (B) HepG2 cells transfected with miR-590-5p mimics or negative control. Representative images are shown at the top, and the quantification of three independent experiments is shown at the bottom. Representative photomicrographs of the membrane-associated cells assayed using hochest-33342 staining (200×) are shown. All data are presented as means ± s.d. of three independent experiments. *p < 0.05.

