Fig. 1.
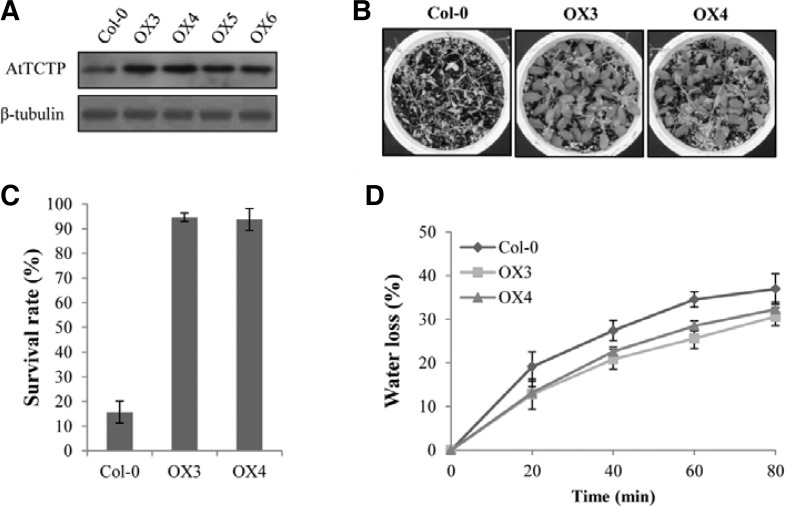
Drought stress responses of AtTCTP overexpression (OX) lines. (A) Western blot analysis of AtTCTP proteins in OX lines. Crude extracts from ten-day-old seedlings of Col-0 and OX lines were used for the western blot analysis with the AtTCTP-specific antibody. The β-tubulin was shown as a loading control. (B) Drought tolerance assays of the OX lines. The plants were re-irrigated 18 days after drought treatment, and the pictures were taken three days after re-hydration. (C) Average survival rates of the OX lines compared with Col-0. Each analysis with 30 plants was repeated three times. Error bar = SD (n = 3). (D) Water loss rates with detached leaves from the Col-0 and OX lines. Leaves at similar developmental stages were excised and weighed at the indicated after detachment. The proportion of fresh weight losses was calculated on the basis of the initial weight of the leaves. Each data point represents the mean with SD (n = 20).

