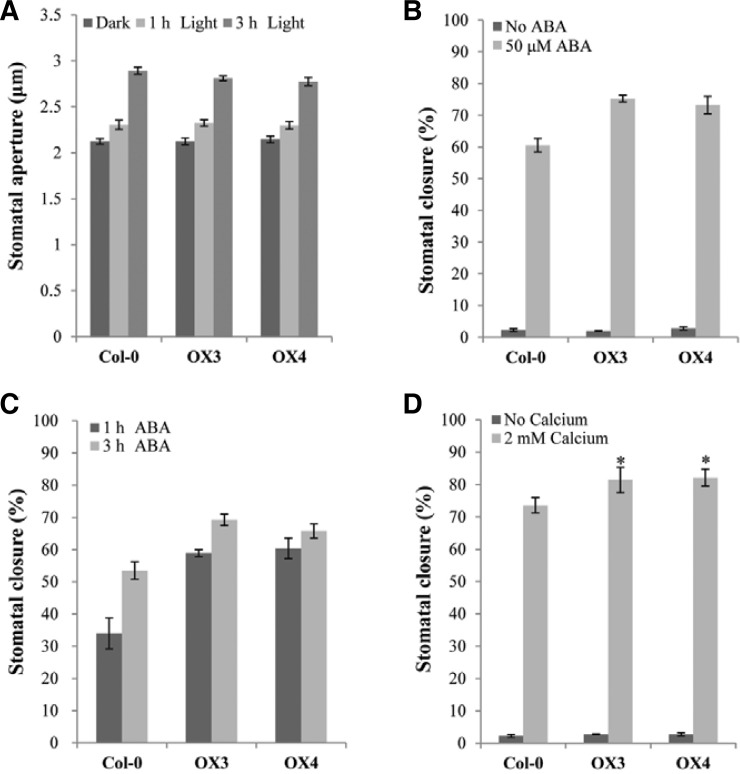
Fig. 3.
Stomatal movement of AtTCTP overexpression lines. (A) Light-induced stomatal opening. White light (100 μmol·m−2·s−1) was applied to dark-incubated epidermal strips for light-induced stomatal opening. Stomatal apertures of ten randomly selected stomata from Col-0 and OX lines were measured under the microscope. Each assay was repeated three times. Error bar = SE (n = 3). (B) ABA-induced stomatal closure. Stomatal closure ratios were scored 4 h after the addition of 50 μM ABA. (C) ABA-induced stomatal closure ratios in a time-dependent manner. Stomatal closure ratios were scored at the indicated times after ABA treatment. (D) Calcium-induced stomatal closure. Stomatal closure ratios were scored 4 h after the addition of 2 mM CaCl2. For (B) to (D), stomata had been pre-opened by incubating for 4 h in white light. 200 randomly selected stomata were used for the assay and each assay was repeated three times. Error bar = SD (n = 3). Asterisks show significant differences with a P < 0.01 (t-test) vs. Col-0.

