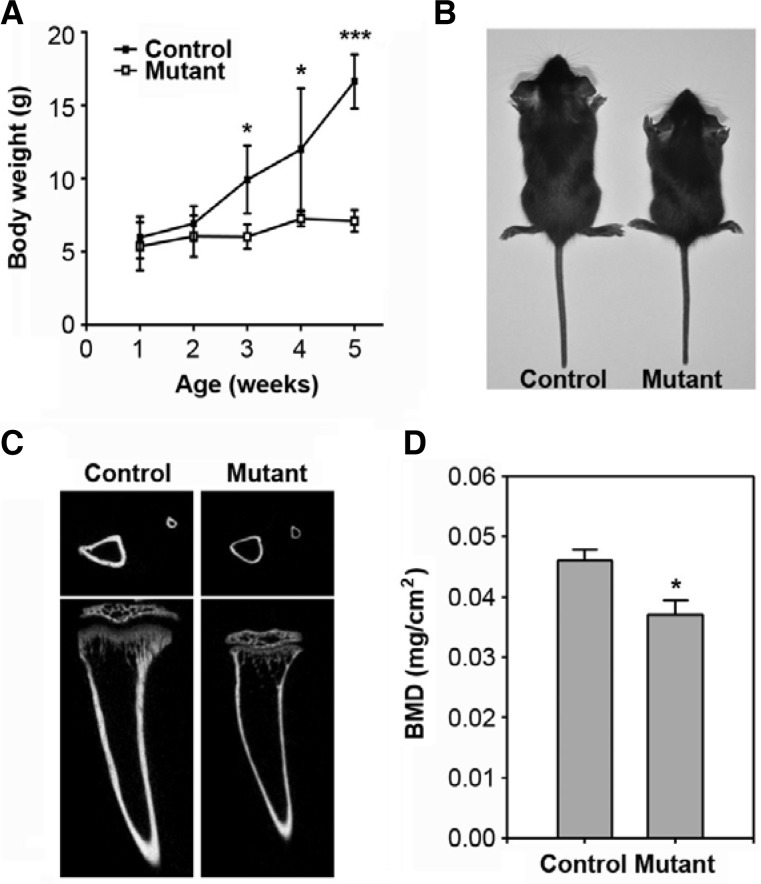
Fig. 1.
Postnatal retardation of growth and bone formation in SmoM2;OCN-Cre mutant mice. (A) Body weight of SmoM2 mutant and control mice was measured at the indicated weeks of age. The data indicate the mean ± SD (n = 5 in each group). (B) A representative image showing gross appearance of the mutant and control mice at 4 weeks of age. (C) MicroCT images of tibias from 4-week-old mice. (D) Bone mineral density was determined from the tibias of the two mice groups and is represented as the mean ± SD (n = 5 in each group). *P < 0.05 and ***P. < 0.001 indicate significant differences between the control and mutant mice.

