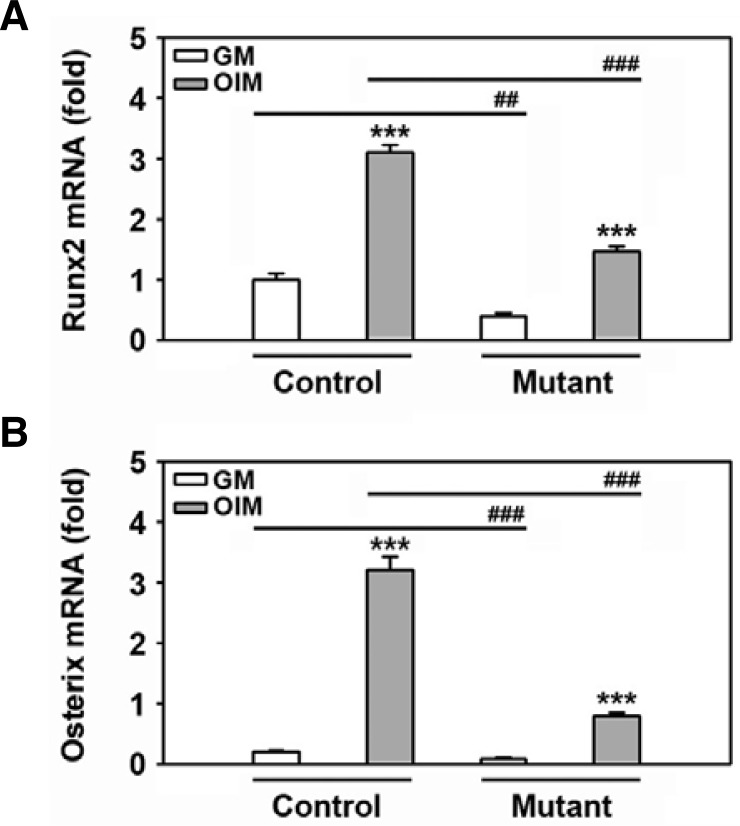
Fig. 5.
Different Runx2 and osterix mRNA expression levels in response to DAG between control and mutant mice. Primary calvarial cells were isolated from the SmoM2;OCN-Cre mutant or the control at 2 weeks of age. The cells were incubated in GM or OIM for 24 h and then processed for real time RT-PCR. The results show the mean ± SD from three independent experiments. ##P < 0.01 and ###P < 0.001 vs. the experiments.

