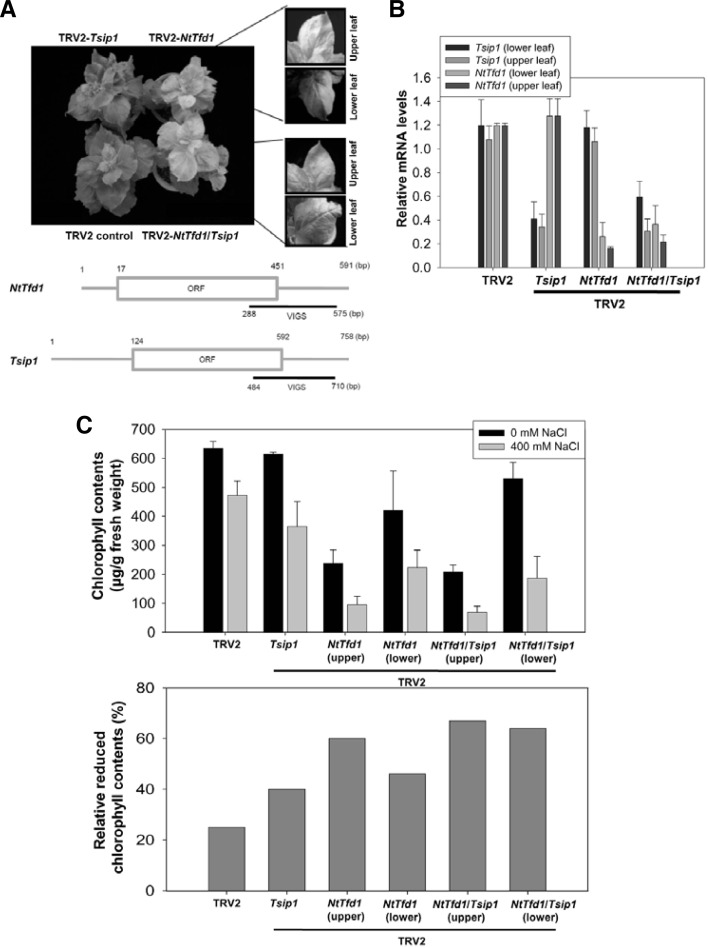
Fig. 5.
Phenotype analysis of NtTfd1 silencing and NtTfd1/Tsip1 double silencing upon salt stress condition. (A) Silencing phenotype of TRV2::NtTfd1, TRV2:: Tsip1, and TRV2::NtTfd1/Tsip1. Pale green phenotype was divided into upper (severe) and lower (mild) leaves. The bottom illustration shows VIGS region of NtTfd1 and Tsip1 for gene silencing. (B) Silencing levels of NtTfd1 and Tsip1 in the TRV2:: NtTfd1, TRV2::Tsip1, and TRV2:: NtTfd1/Tsip1 plants upon salt stress (400 mM NaCl) condition. Error bars indicate strandard deviation (n = 5). (C) Chlorophyll contents and relative reduced chlorophyll contents of TRV2:: NtTfd1, TRV2::Tsip1, and TRV2:: NtTfd1/Tsip1 plants upon 400 mM NaCl treatment. Error bars indicate standard deviation (n = 12).

