Fig. 6.
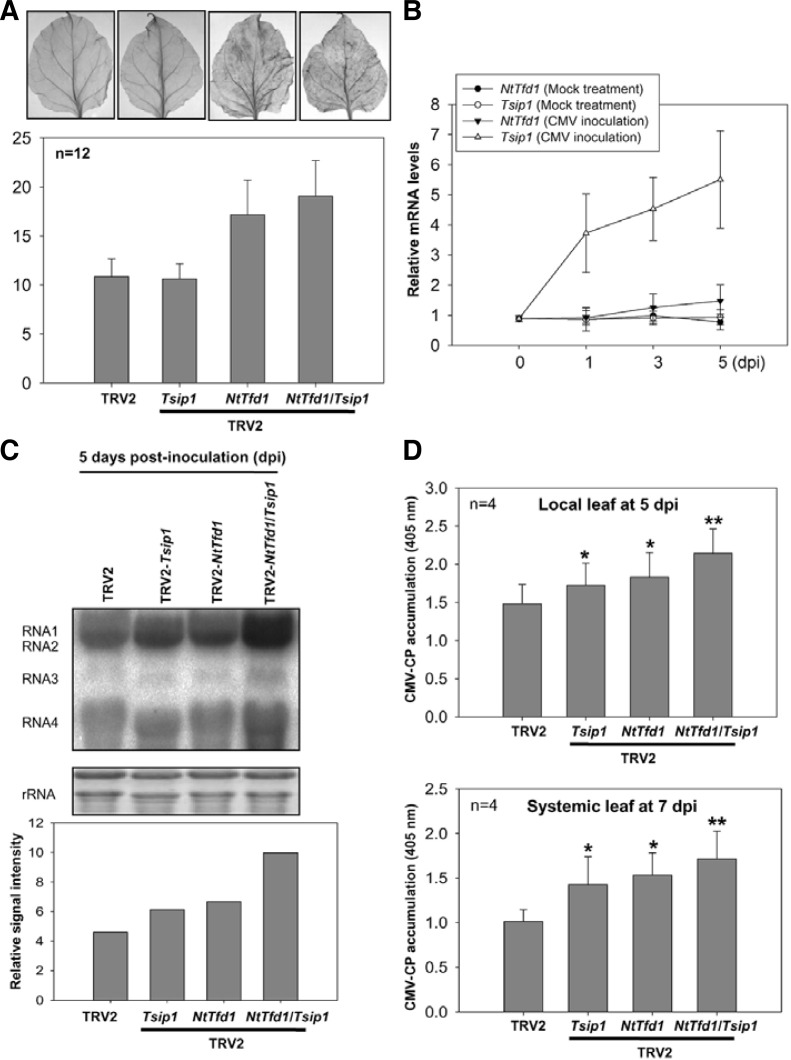
Phenotype analysis of NtTfd1 silencing and NtTfd1/Tsip1 double silencing against CMV infection. (A) ROS detection in the TRV2 control, Tsip1-, NtTfd1-, and NtTfd1/Tsip1-silenced plants. Hydrogen peroxide was detected by DAB staining. Silenced plants were vacuum-infiltrated and incubated for 8 h. And then samples were further incubated in 70% ethanol until the chlorophyll was removed. DAB staining intensity was analyzed with image J program (http://rsbweb.nih.gov/ij/). Error bars indicate standard devia-tion (n = 12). (B) Expression pattern of NtTfd1 and Tsip1 upon CMV inoculation. CMV or mock inoculated plants were harvested and RNA samples were extracted by hot phenol method. Transcript levels were analyzed by quantitative RT-PCR. Error bars indicate standard deviation (n = 3). (C) RNA blot analysis in the TRV2 control, Tsip1-, NtTfd1-, and NtTfd1/Tsip1-silenced plants upon CMV inoculation. In CMV inoculated plants at 5 dpi, CMV RNAs were detected with CMV-3’ UTR-specific probe. Signal intensity of RNA blot was analyzed with image J program. (D) CMV accumulation in both local (CMV inoculated) and systemic upper (non-inoculated) leaves was detected via indirect ELISA. Error bars indicate standard deviation (n = 4). Asterisks represent statistically significant differences between CMV inoculated TRV2 control and silenced plants (Student’s t-test; *p < 0.05,**p < 0.001).

