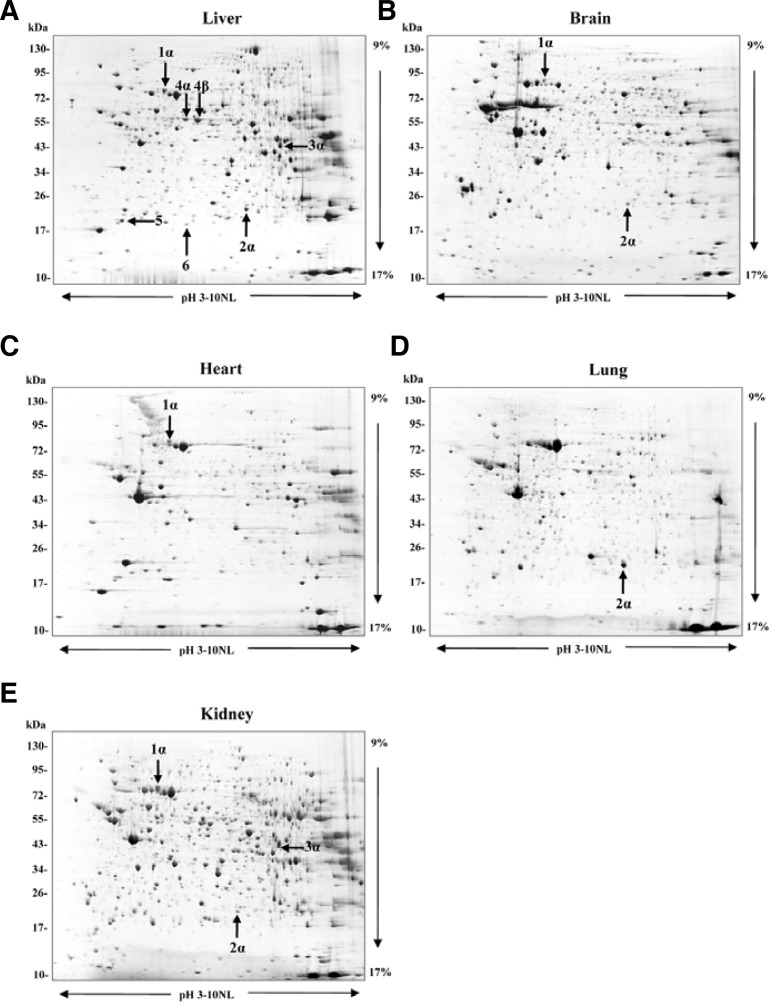
Fig. 1.
Two-dimensional electrophoresis gel maps of bi-1+/+ mouse tissues. Separation was performed with 1 mg of protein on pH 3–10 nonlinear immobilized pH-gradient strips, followed by a 9–17% gradient SDS-PAGE gel. The gel was stained with Coomassie blue G-250. Protein spots were identified using MALDI-TOF. Complete names and UniPROTKB accession numbers are provided in Table 1. (A) Liver, (B) Brain, (C) Heart, (D) Lung, (E) Kidney.

