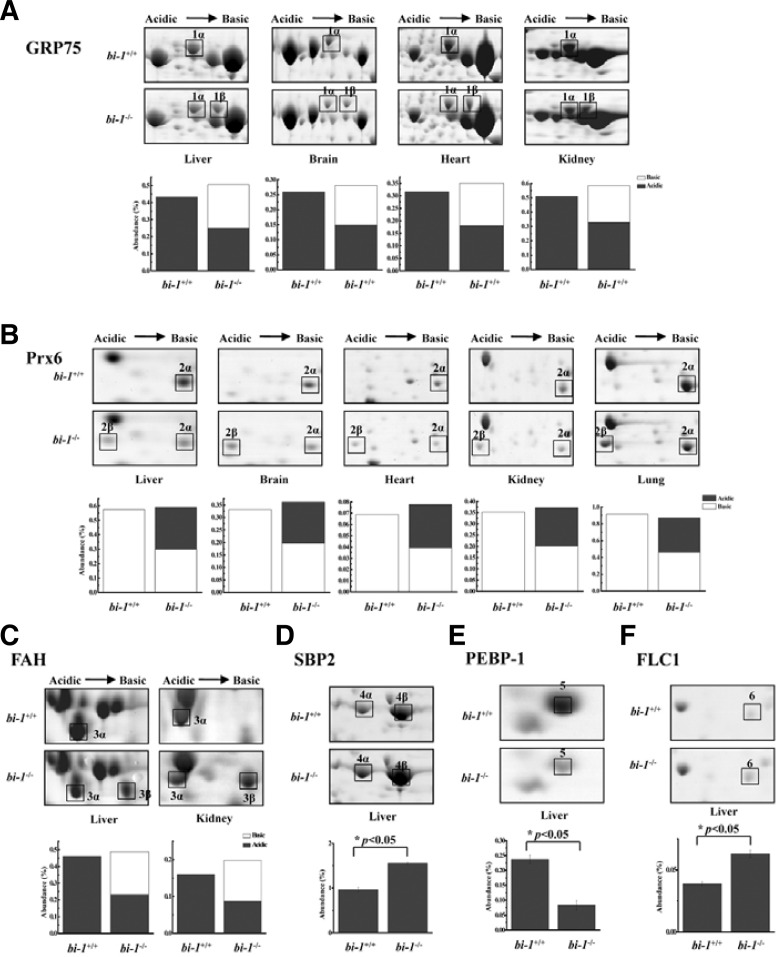
Fig. 2.
Two-dimensional electrophoresis gel image enlargements of GRP75, Prx6, FAH, SBP2, PEBP-1 and ferritin light chain 1 in bi-1+/+ and bi-1−/− mouse liver tissues. (A) Representative tissue pairs are shown. Arrows indicate the protein spots corresponding to GRP75 (A), Prx6 (B), FAH (C), SBP2 (D), PEBP-1 (E) or ferritin light chain 1 (FLC1) (F). Bar chart represents protein abundance (%). The white bar represents the basic form, and the black bar represents the acidic form. The total height of each bar represents the sum of the two forms (A) to (C). Complete protein names and UniPROTKB accession numbers are provided in Table 1. *P < 0.05; significantly different from bi-1+/+ tissues.

