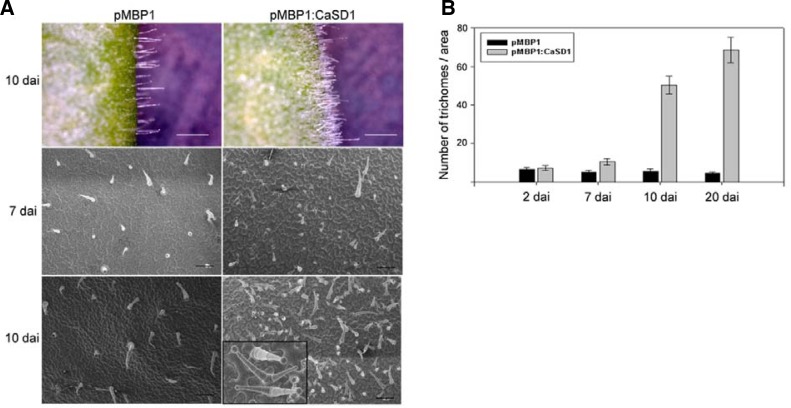
Fig. 5.
Increase in trichome density in CaSD1-overexpressing N. benthamiana. (A) Surfaces of pMBP1 vector control (left) or CaSD1-overexpressing (right) N. benthamiana leaves were observed at the indicated time points after TOE by light microscopy or field-emission scanning electron microscopy. White bars, 1 mm. The bottom right hand black box is magnified for clusters of adjacent trichomes. Black bars, 200 μm. (B) pMBP1 vector control (Black) or CaSD1-overexpressing leaves (grey) were comparted into 2 mm × 1.4 mm regions, and trichomes in the fixed regions were counted at the indicated time points after TOE. Bars represent standard deviation (n = 5).

