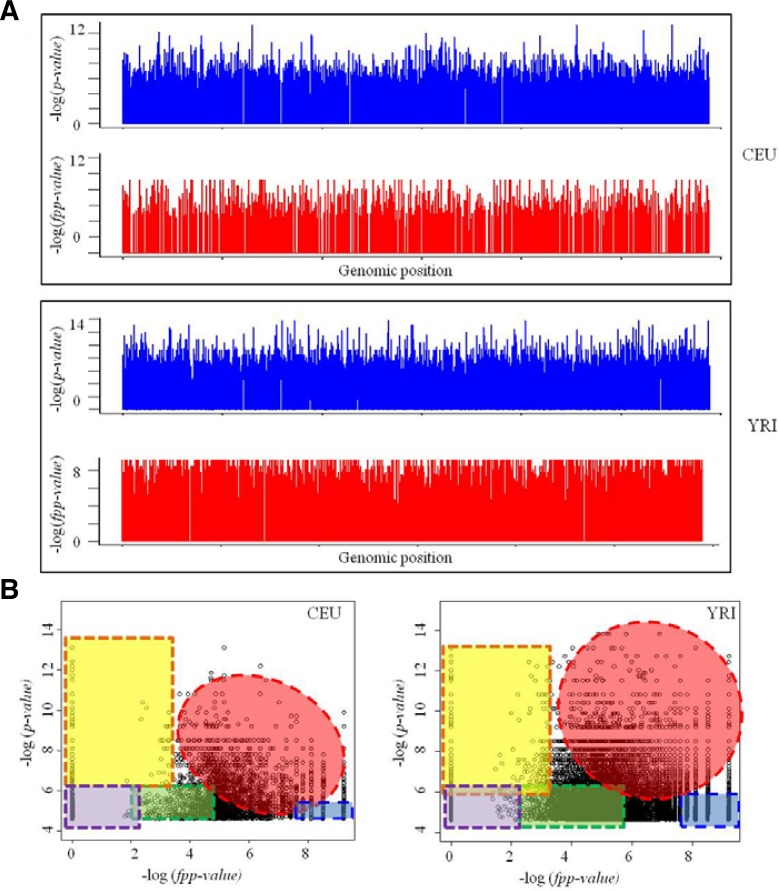
Fig. 2.
Results of functional prioritization approach after GWAS. (A) The original p-values plotted against genomic position (blue colored peaks). Results of functional prioritization method (red colored plot). CEU and YRI means analyzed populations. (B) The original p-values plotted against results of functional prioritization values (fpp-values). Signals in the redcolored regions correspond to the prioritized SNPs by both of the significant p-value and weighting effect via fpp-value analysis. The yellow and blue shaded regions show the differences between these two methods. The purple shaded region displays non-significant SNPs by both of methods. The green colored region denotes SNPs which have p-values and fpp-values at intermediated levels.

