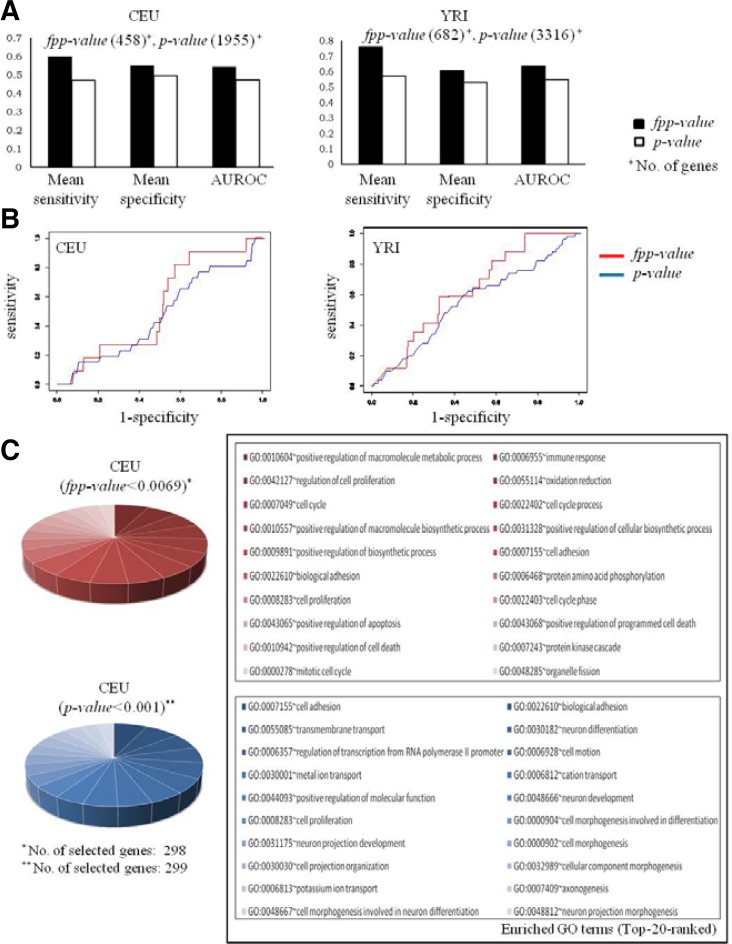
Fig. 3.
Performance evaluation and enrichment test for the functional annotation of selected genes. (A) Performances of functional prioritization approach and previous straight p-value approach. Both of panels are measured performance in CEU (left) and YRI (right) populations. (B) Panels for ROC analysis. (C) Results of enrichment test using GO terms (category of Biological Process).

