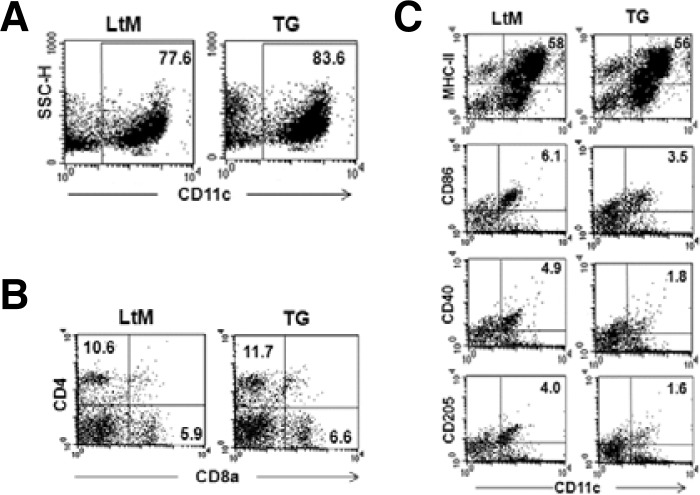
Fig. 4.
Analyses of subset populations and surface marker expression in DCs isolated from the spleens of p190RhoGEF TG mice. CD11c+ DCs were isolated from the spleens of each genotype group and were purified as described in the Methods section. Purified DCs were labeled with PE-conjugated anti-CD11c mAb along with combinations of mAbs for different surface co-receptor molecules followed by three-color flow cytometric analyses. (A) The results are presented as a dot plot, showing the cellular change (SSC-H) vs. CD11c staining. The CD11c+ DC population was compared as a percentage of the total cells. (B) For the cell populations gated by CD11c expression, dot plots are presented for CD4 (PerCP) vs. CD8a expression (FITC). The CD4+ myeloid and CD8a+ lymphoid DC populations were compared by the percentage of total cells. (C) Dot plots compare the expression of MHC-II, CD86, CD40 or CD205 vs. CD11c. The populations of CD11c+ DCs expressing each surface molecule were reported as the percentage of total cells. The fluorescence intensities of the cells stained with an isotype control Ab or antiserum were all corrected (data not shown). Experiments were performed in three distinct TG lineages at least. The data are representative of three separate experiments.

