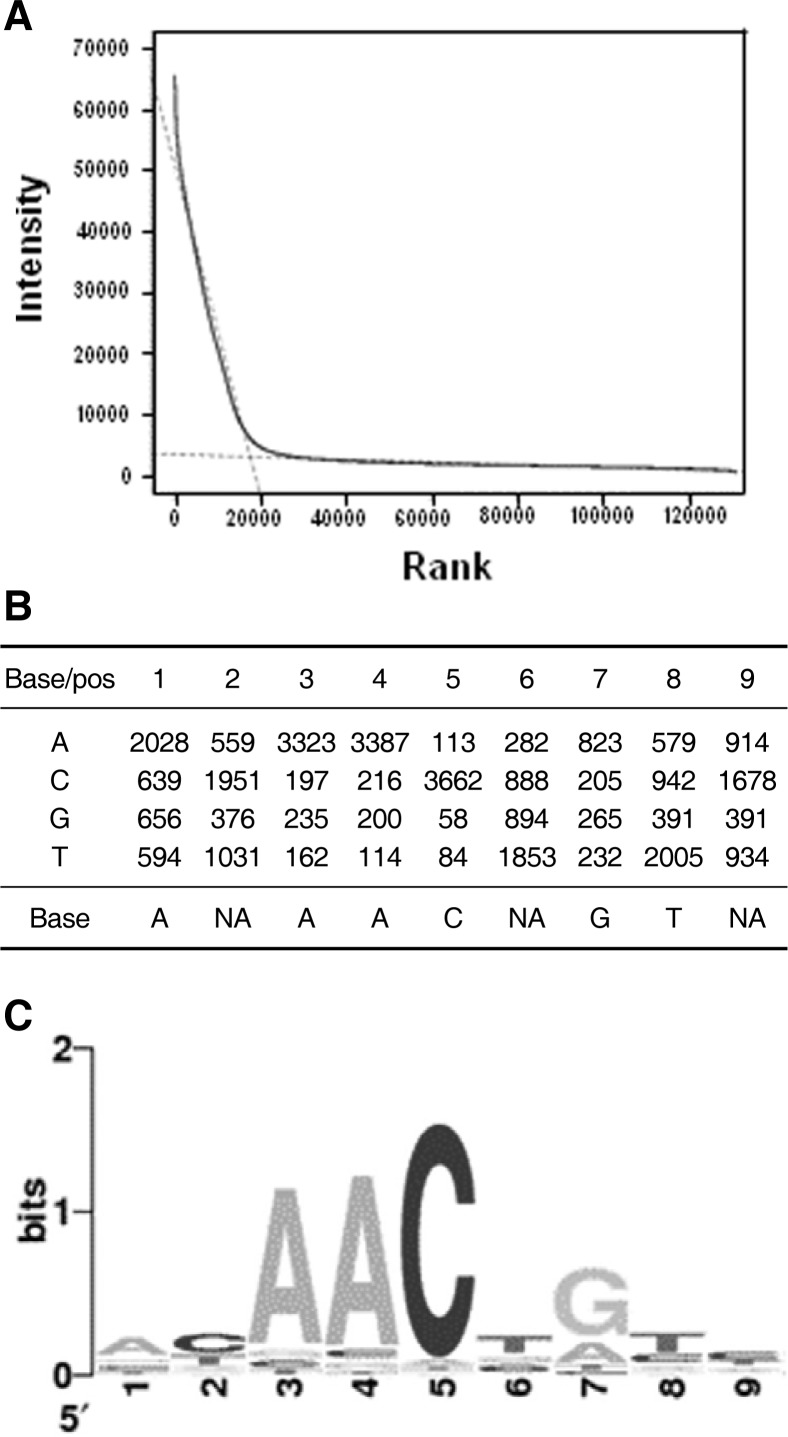
Fig. 2.
Schematic representation of protein binding microarray analysis. (A) Rank analysis of AtMYB44 PBM binding. From the rank-ordered signal distribution, two independent linear models, y = ax + b, were applied in the steep (b1 = 51384.5, slope = −2.7) and the heavy right (b1= 3469.8, slope = −0.021) tail regions. Rank extrapolation was 17818. (B) Total position weight matrix. Spots that exhibited strong intensity and high enrichment were subjected to alignment. These groups were denoted by SEQLOGO ‘Visualize information content of patterns’ [http://www.bioinf.ebc.ee/EP/EP/SEQLOGO/]. (C) Sequence logo of the determined consensus binding sequence of AtMYB44.

