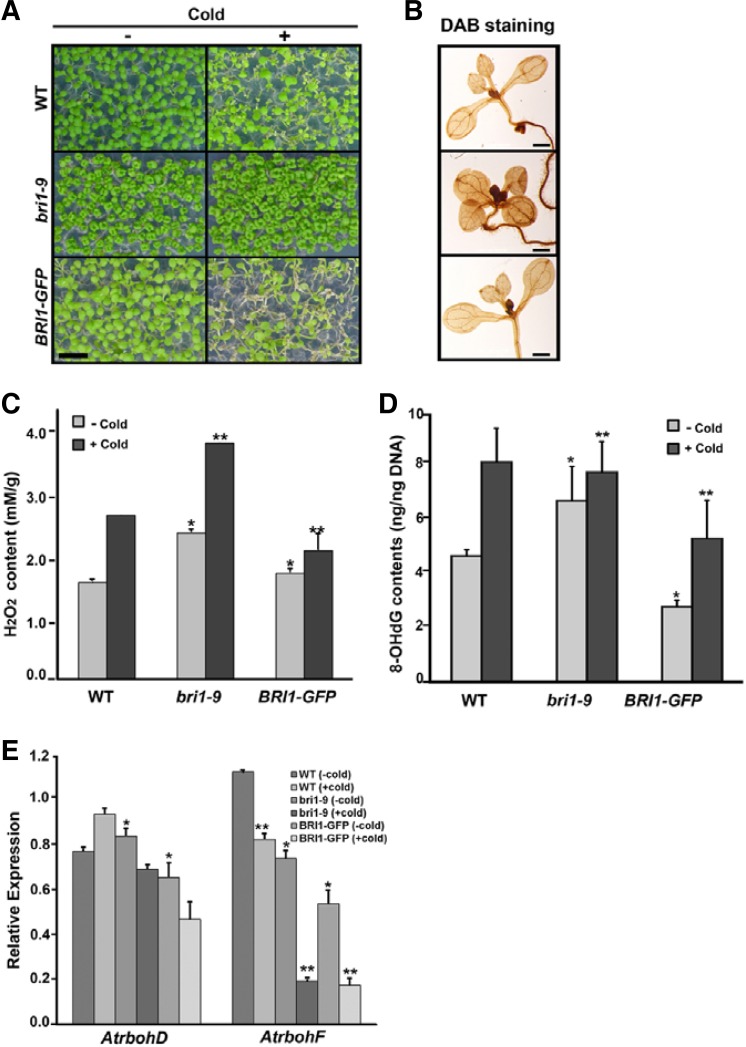
Fig. 1.
Brassinosteroid-signaling mutant contains higher ROS levels. (A) Cold-stressed phenotypes of bri1-9 and BRI1-GFP seedlings Pictures were taken 48 h after cold treatment. Scale bars denote 5 mm. (B) DAB-staining pattern showing accumulation of ROS in seedlings. Bar indicates 1 mm. Hydrogen peroxide concentrations (C) and formation of 8-OHdG (D) were determined from whole seedlings that were treated with or without cold. Bar denotes standard error. ANOVA statistical analyses were performed, and significant differences are indicated by P values [*P ≤ 0.001 and **P ≤ 0.0001 in (C); and *P ≤ 0.001 and **P ≤ 0.05 in (D)]. (E) The expression of AtrbohD and AtrbohF genes in bri1-9 and BRI1-GFP seedlings compared with that of wild type with or without cold (*P ≤ 0.05, **P ≤ 0.001).

