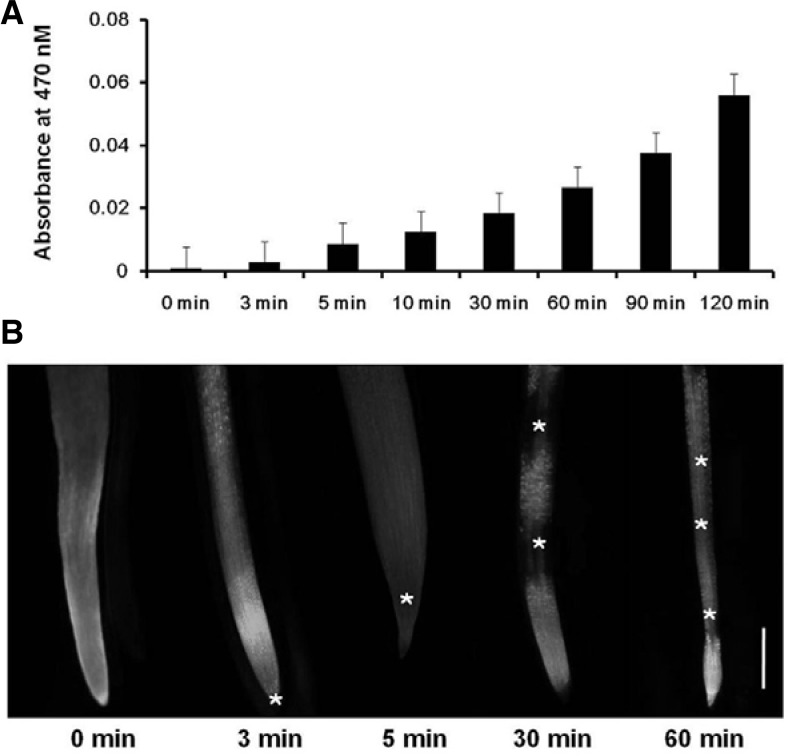
Fig. 1.
ROS generation in soybean root during NaCl treatment. (A) Soybean seedlings were treated with 300 mM NaCl for the indicated times, and then O2− generation was measured using XTT-formazan using a spectrophotometer at A470. Mean ± SD of 2 samples. (B) Soybean seedlings were treated with 10 μM CM-H2DCFDA for 60 min, followed by 300 mM NaCl treatment for the indicated times. H2O2 generation signals in secondary roots were detected using the FITC channel of a fluorescence microscope. (*) indicates H2O2 signal. Scale bar = 1 mm.

