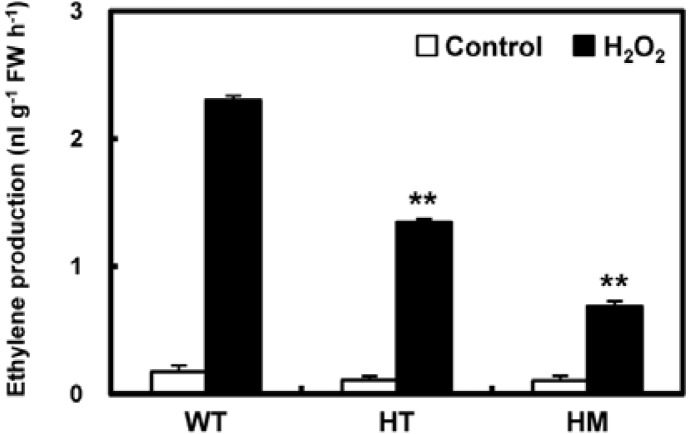
Fig. 4.
Analysis of stress-induced ethylene production in WT and osldc-like 1 mutants. Ethylene was measured by floating leaf segments on 20 mM MES buffer without (controls, open bars) or with 50 mM H2O2 (final concentration; filled bars) and then incubating the leaves in air-tight glass vials for 1 h under illumination (photon flux density of 50 bar−1s−1). Significant differences between H2O2-treated osldc-like 1 and WT plants based on the two-tailed Student’s t-test are indicated by two asterisks (P < 0.01).

