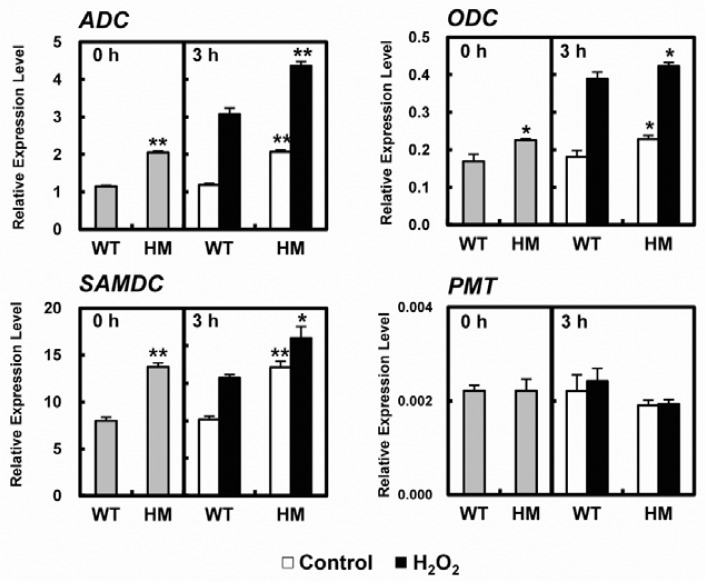
Fig. 6.
Quantitative real-time RT-PCR analysis of ADC, ODC, SAMDC and PMT transcripts. Expression levels, normalized to the reference gene β-actin, were calculated after qRT-PCR using gene-specific primers. At time 0, leaf discs were treated with 50 mM H2O2 in 20 mM MES buffer for 3 h. Relative expression is reported as the means ± SDs. Significant differences between H2O2-treated osldc-like 1 HM and WT rice plants based on the two-tailed Student’s t-test are indicated by one (P < 0.05) or two asterisks (P < 0.01).

