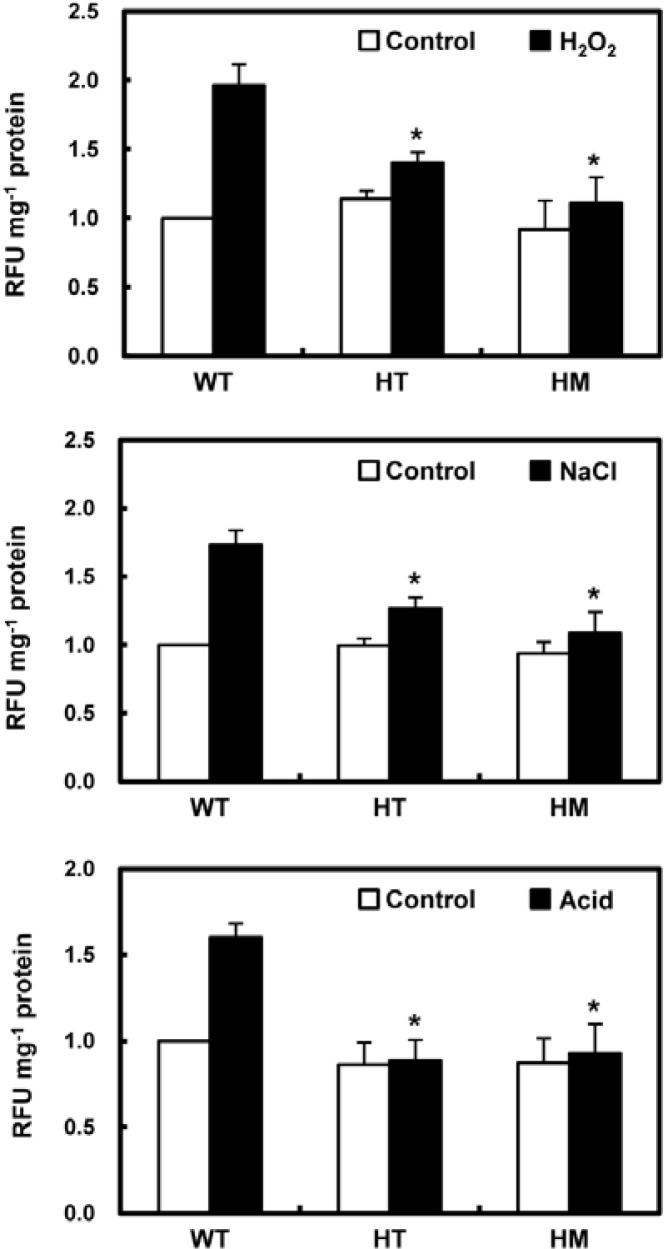
Fig. 8.
Analysis of intracellular ROS levels in leaf segments of WT and osldc-like 1 rice plants in response to abiotic stresses. Rice leaves were subjected to oxidative stress (top panel) with 50 mM H2O2 for 30 min, salt stress (middle panel) with 200 mM NaCl, or acid stress (bottom panel) with 10 mM potassium phosphate buffer (pH 3.0). ROS were measured by DCFH-DA fluorescence. Values were normalized to total protein content in leaf extracts and relative fluorescence units (RFU) were calculated relative to the value obtained for control treatment of WT plants. RFUs are reported as the means ± SD. Significant differences between stress-treated osldc-like 1 and WT rice plants based on the two-tailed Student’s t-test are indicated by one asterisk (P < 0.05).

