Fig. 3.
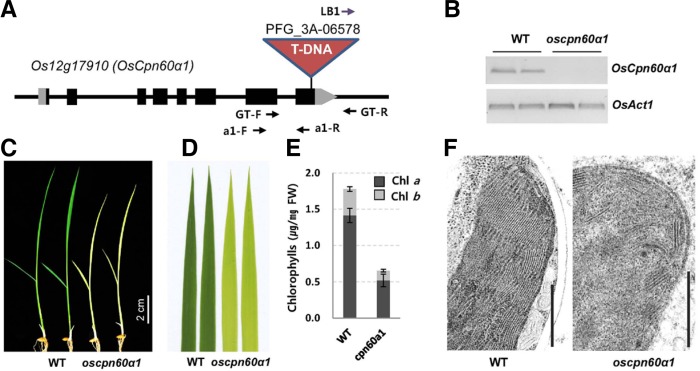
Phenotypes of oscpn60α1 mutant. (A) Schematic diagram of OsCpn60α1 genomic structure. Black box, exon; gray box, UTR region. T-DNA insertion, genotyping primers (GT-F, GT-R, and LB1), and RT-PCR primers (a1-F and a1-R) are depicted. (B) RT-PCR analysis of OsCpn60α1 expression in segregant WT and oscpn60α1 mutants. OsActin1 was internal control. (C) Phenotypes of oscpn60α1 mutant; 11-d-old seedlings were photographed. (D) Enlarged image of 3rd leaves in C. (E) Quantification of chlorophyll after being extracted from 3rd leaves of 10-d-old seedlings grown at constant 27°C. Error bars indicate standard deviations; n = 5. (F) TEM image of chloroplasts. Scale bar = 0.5 μm.

