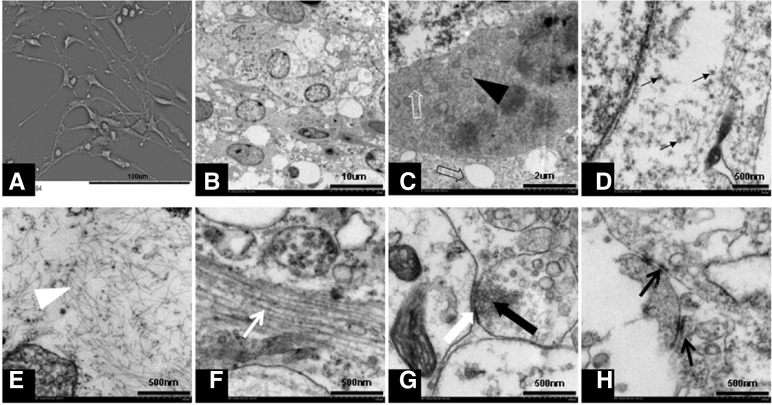
Fig. 6.
Representative SEM and TEM images on amino modified and PLL coated surfaces. (A) A representative graph of all SEM analysises of NSCs after five days of culturing, stretched-out protrusions were visible. (B–H) representative graphs of TEM analysises on all tested surfaces. (B) Observation of neural stem cells after seven days of culturing: visible cell morphology showing a large nucleus, inverted nuclearcytoplasm ratio, and small transparent cytoplasm; (C) the black solid arrow indicates mitochondria, the white hollow arrow indicates rough endoplasmic reticulum, and the black hollow arrow indicates expanded endoplasmic reticulum; (D) the black arrow indicates the white solid of the ribosome; (E) the white arrow indicates glial microfilaments; (F) the white arrow indicates neural microtubules; (G) the white solid arrow indicates synaptic cleft, the black solid arrow indicates neurotransmitter vesicles inside of the presynaptic membrane; and (H) the black arrows indicate the connections between cells. Scale bar in (A), 100 μm; scale bar in (B), 10 μm; scale bar in (C), 2 μm; scale bar in (D–G), and (H), 500 nm.

