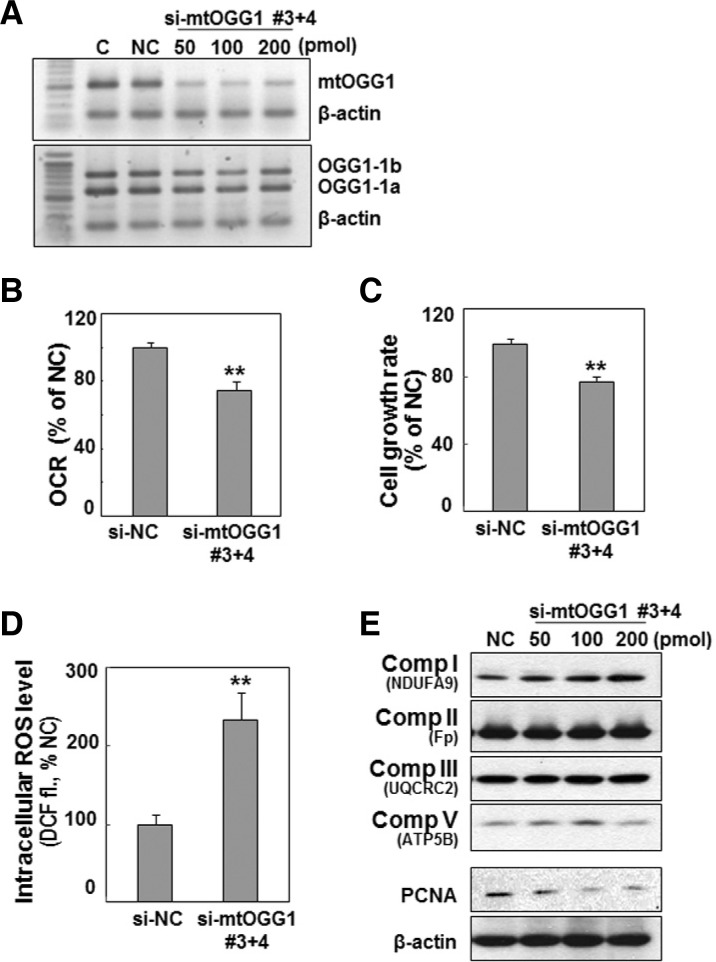
Fig. 5.
Knockdown of mtOGG1 expression decreases cellular respiration and cell growth. Chang-L cell was treated with the indicated amounts of siRNAs for OGG1-2a for 48 h. (A) mRNA levels were monitored by RT-PCR with the F1/R2 primer set (shown in Fig. 3A). (B) Cellular oxygen consumption rates were measured using Mitocell respirometer as described in “Materials and Methods”. (C) Cell growth rates were monitored by counting trypan blue positive cells. No clear dead cells were observed. (D) Intracellular ROS levels. (E) Western blot analysis. **, < 0.01 vs. negative control siRNA (si-NC).

