Fig. 3.
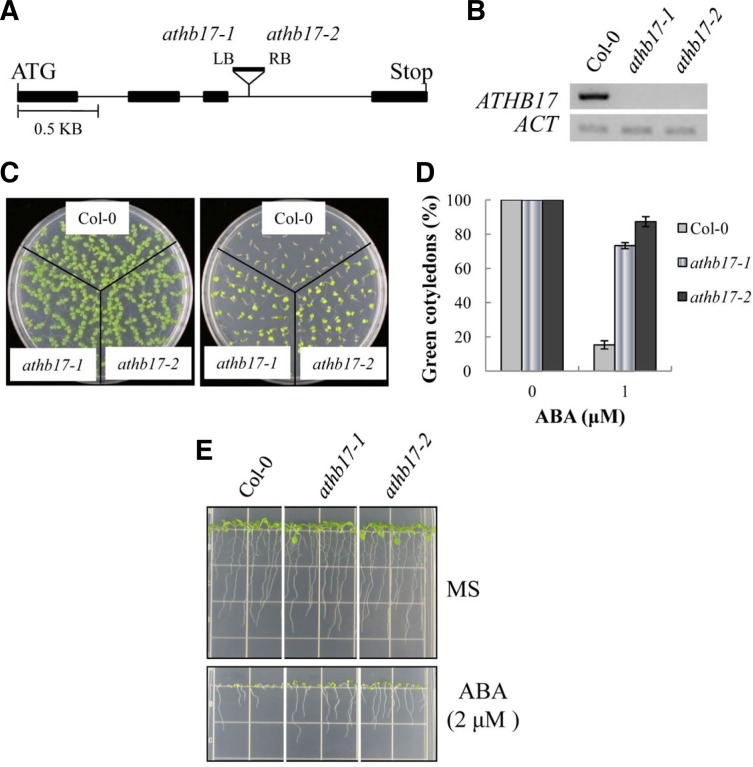
Phenotypes of the ATHB17 knockout (KO) line. (A) Schematic diagram depicting the T-DNA insertion site in the KO lines (athb17-1 and athb17-2). The filled bars represent exons, whereas the thin lines indicate introns. (B) ATHB17 transcript levels in the KO lines were determined by semi-quantitative RT-PCR. (C) Seedlings grown in ABA-free MS medium (left panel) or in MS medium containing 1 μM ABA for 7 days. (D) Cotyledon greening efficiency of the seedlings in (C). The values represent the mean of three independent experiments (n = 50 each), and the small bars represent standard errors. (E) Seedlings were grown in a vertical position for 8 days to examine root growth.

