Fig. 6.
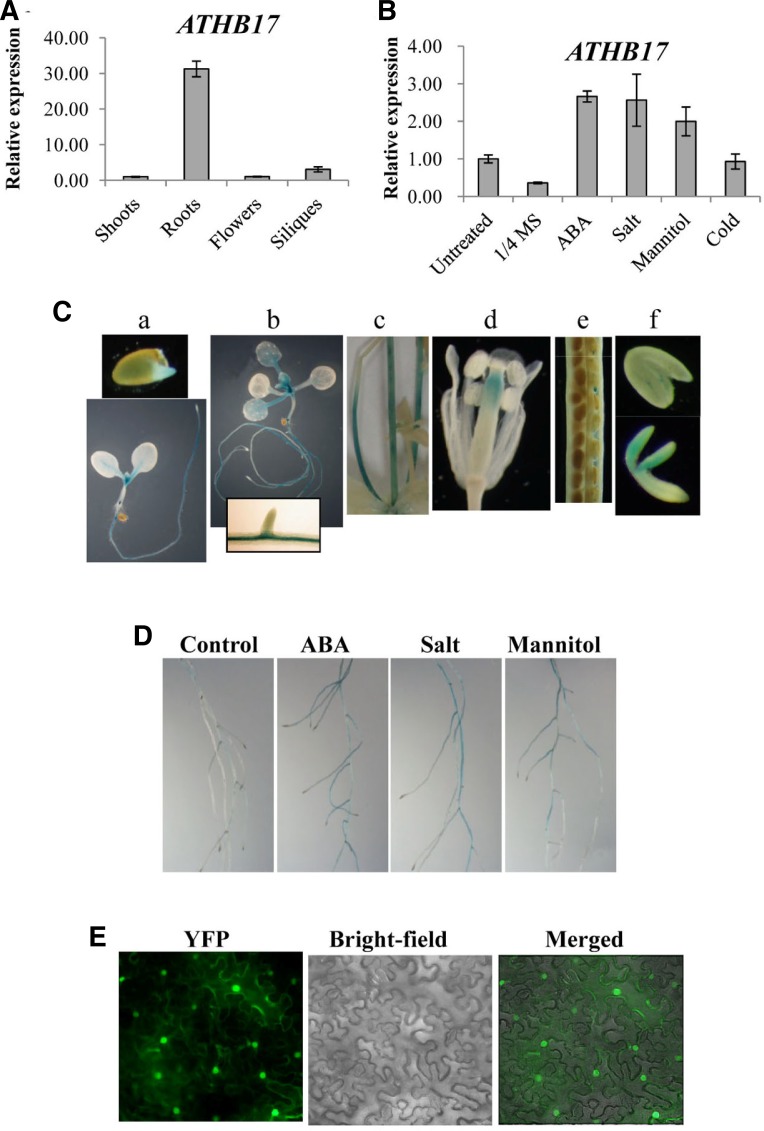
Expression patterns of ATHB17. (A) Tissue-specific expression patterns of ATHB17 were determined by Real-time PCR. The values represent the relative expression levels compared with that of the young seedling shoots. (B) Induction patterns of ATHB17. Induction levels of ATHB17 by ABA (100 μM, 4h), Salt (250 mM NaCl, 4 h), mannitol (600 mM, 4 h), and cold (4°C, 24 h) were determined by Real-time PCR. (C) ATHB17 promoter activity was determined by histochemical GUS staining. a, one-day-(top) and five-day-old (bottom) seedlings. b, 10-day-old seedlings. The inset in the bottom shows part of primary root. c, inflorescence stem. d, flower. e, silique. f, mature (top) and immature (bottom) embryos. GUS staining was carried out for 24 h. (D) ATHB17 promoter activity in 7-day-old seedling roots. Roots were treated with 1/2 MS (control) or with 1/2 MS medium containing ABA (100 μM), Salt (250 mM NaCl), or mannitol (600 mM) for 4 h before staining. GUS staining was for 1.5 h (E) Subcellular localization of ATHB17. Tobacco leaves were infiltrated with Agrobacterium harboring an ATHB17-YFP fusion construct and were observed with a fluorescence microscope 40 h after the infiltration. Fluorescence (YFP), bright-field, and merged images are shown.

