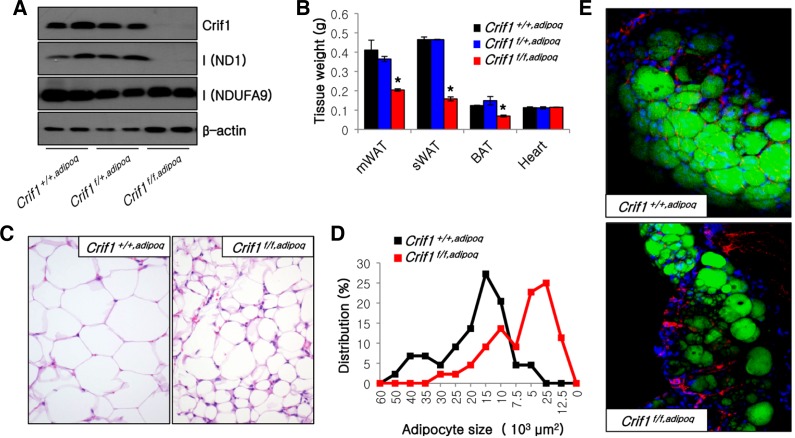
Fig. 1.
Perturbation of adipose tissue development in Crif1f/f,adipoq mice. (A) Western blot analysis of eWAT probing for Crif1 and the OXPHOS complex I subunits NDUFA9 and ND1, which are encoded by nDNA and mtDNA, respectively. The β-actin was used as an internal control. (B) Tissue weight of mice (n = 10 for each group; means and s.d.s are shown; *P < 0.05). mWAT, mesenteric WAT; sWAT, subcutaneous WAT; BAT, brown adipose tissue. (C) Hematoxylin and eosin staining of eWAT. Magnification, × 200. (D) Distribution of adipocyte sizes in eWAT as shown in Fig. 1C. (E) Immunofluorescence image of eWAT stained with BODIPY (green), DAPI (blue) and an anti-PECAM antibody (red). Magnification, × 200.

