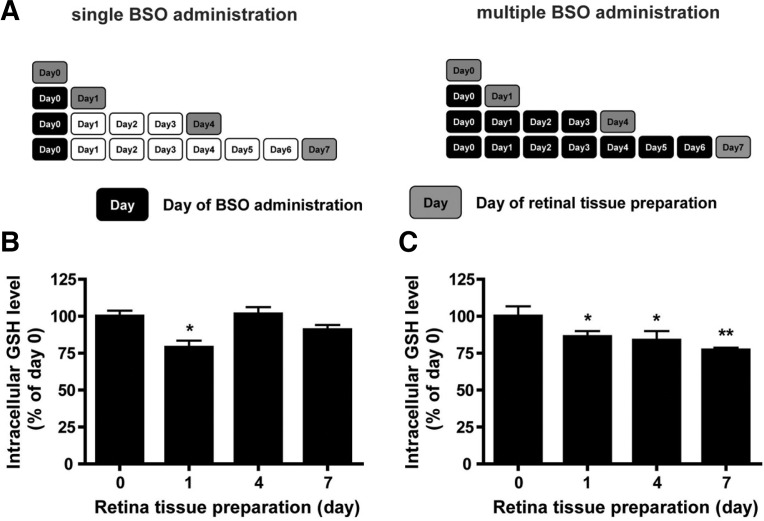
Fig. 1.
Changes in glutathione level after BSO administration in mouse retina. (A) Experimental scheme of BSO administration. Black boxes represent the days of BSO administration, whereas gray boxes indicate the days when retina tissue were collected. White boxes represent days of normal nurture. (B) Retinal GSH changes under single BSO administration condition. (C) Retinal GSH changes under multiple BSO administration condition. Retinal GSH levels were determined from retina tissues of six eyeballs (3 mice). Statistical significances are indicated as *p < 0.05 and **p < 0.01 (one-way ANOVA).

