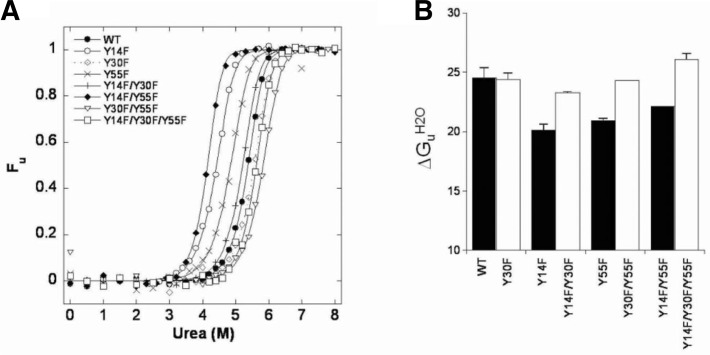
Fig. 3.
Urea-induced unfolding equilibrium transition curves of WT and mutant KSIs. The data were obtained with 15 μM protein in buffer containing 20 mM potassium phosphate, pH 7.0, and 1 mM DTT. (A) Fractional unfolding of each protein was calculated from the change at 222 nm after correction for pre- and post-transition baselines. The data points were fitted to Eqn. (4) to obtain the transition curve, which gave us the ΔGUH2O, [urea]50% and m values listed in Supplementary Table 1. (B) The bar graphs demonstrate the ΔGUH2O values for WT and mutant KSIs.

