Fig. 4.

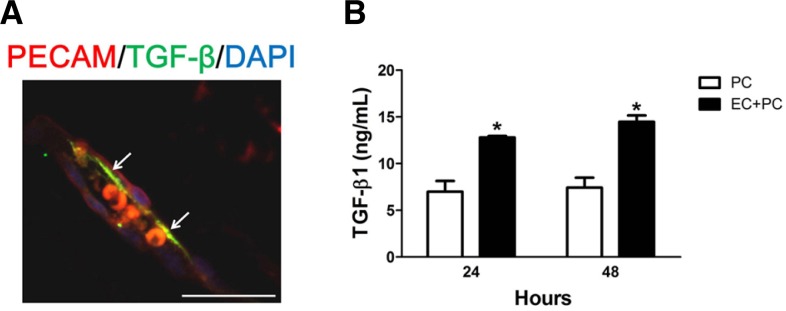
Upregulation of TGF-β induced by interaction between pericytes and endothelial cells. (A) At P8, at which the expressions of tight junction proteins and PDGF-related signaling molecules were the most prominent, the expression of TGF-β1 was examined in TVL. The image is representative of more than 50 vascular lumens of TVL. White arrows indicate distinct colocalization sites of PECAM-1 and TGF-β1, but the immunoreactivity is not confined to the sites with white arrows. Scale bars: 50 μm. (B) The level of TGF-β1 was measured from the culture supernatant by ELISA using the TGF-β1 specific kit. After cultivation of pericytes only and coculture of pericytes and HRMECs, the supernatant was harvested. Each bar represents the mean and the SEM of three independent experiments (*P-value < 0.05). EC, HRMECs; PC, pericytes.
