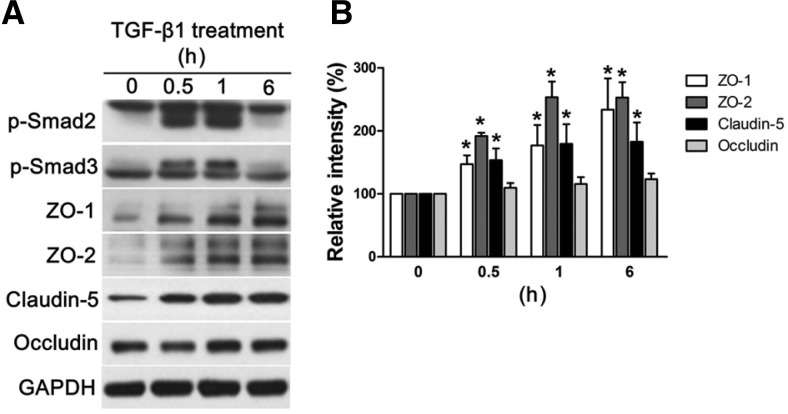
Fig. 5.
Activation of Smad pathway and expression of tight junction proteins induced by TGF-β. HRMECs were treated with TGF-β1 for indicated periods of time and prepared for further analysis with Western blot. (A) Each figure represents three independent experiments. (B) Quantitative analysis was performed by measuring the band intensity of the protein expression in the treatment groups compared to those of control. Each bar represents the mean and the SEM of three independent experiments (*P-value < 0.05). p-Smad2, the phosphorylated form of Smad2 protein; p-Smad3, the phosphorylated form of Smad3 protein.

