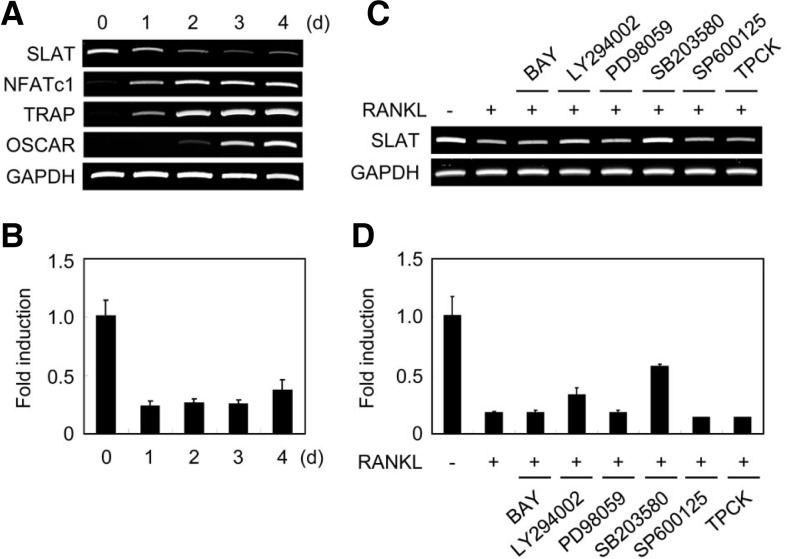
Fig. 1.
SLAT gene expression during osteoclastogenesis. (A, B) BMMs were cultured with M-CSF and RANKL for the indicated times. Total RNA was collected at each time point. (A) RT-PCR was performed to detect expression of the indicated genes. (B) Real-time PCR analysis was performed for the expression of SLAT and GAPDH. (C, D) BMMs were cultured with M-CSF and RANKL for 2 days in the presence of various inhibitors; Mock (DMSO), BAY (20 μM), LY294002 (10 μM), PD98059 (20 μM), SB203580 (20 μM), SP600125 (5 μM), TPCK (5 μM). RT-PCR (C) and Real-time PCR (D) were performed for the expression of SLAT and GAPDH.

