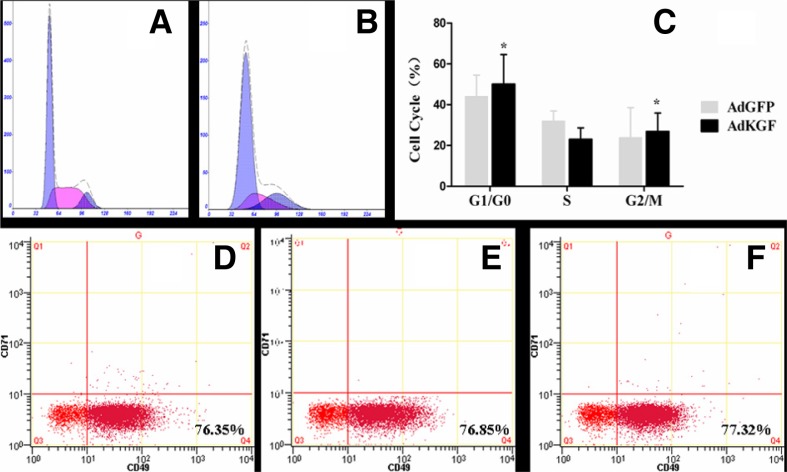
Fig. 3.
Effects of KGF infection on the cell cycle distribution and cell surface antigen expression. hESCs were transfected with AdKGF or AdGFP and subjected to flow cytometric analysis to examine the effect of KGF on cell cycle distribution and cell surface antigen expression (n = 3). (A, B) Representative blots for the AdGFP group (A) and the AdKGF group (B). (C) The percentages of cells in the different cell cycle phases are shown, and significant differences between the AdGFP and AdKGF groups were as follows: the percentage of cells in the G0/G1 phase was lower in the AdGFP group than in the AdKGF group, but the percentage of cells in the G2/M phase was higher in the AdGFP group than in the AdKGF group. *P < 0.05. (D–F) Flow cytometric analysis showed no differences in CD49f or CD71 expression among cells of the untransfected group (D), the AdKGF group (E), and the AdGFP group (F).

