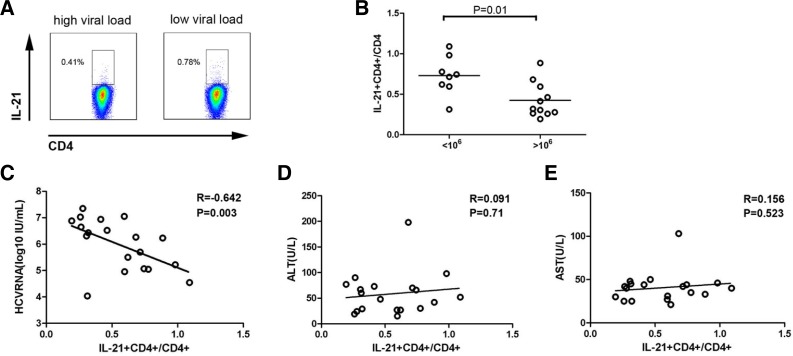
Fig. 1.
Peripheral HCV-specific IL-21+CD4+ T cell responses were negatively correlated with the HCV RNA viral load. (A) Representative dot plots of HCV-specific IL-21+CD4+ T cells from low viral load and high viral load groups of CHC patients following core peptide pool stimulation. (B) Pooled data indicate the percentages of HCV-specific IL-21+CD4+ T cells in low viral load and high viral load groups of CHC patients (n = 19). Horizontal bars represent the median HCV-specific IL-21+CD4+ T cell numbers. One dot represents one individual. Correlations between HCV-specific IL-21+CD4+ T cell frequency and plasma HCV RNA (C), serum ALT (D) and AST (E) in CHC patients. One dot represents one individual. P-values are shown.

