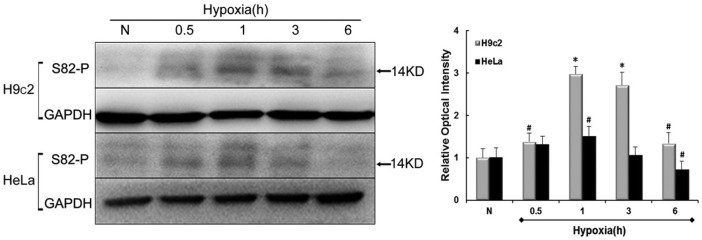
Fig. 1.
Levels of S82 phosphorylation in hypoxia. Immunoblots represent changes in levels of S82 residue phosphorylation in either H9c2 or HeLa cell line at normoxia (N) and 0.5, 1, 3, 6h of hypoxia. The histogram to the right shows relative optical density analysis. GAPDH was chosen as an internal control. Values were compared to N values, set to 100% respectively and the other values normalized accordingly. Data are mean ± SEM (n = 3). #P < 0.05; *P < 0.01 vs. N.

