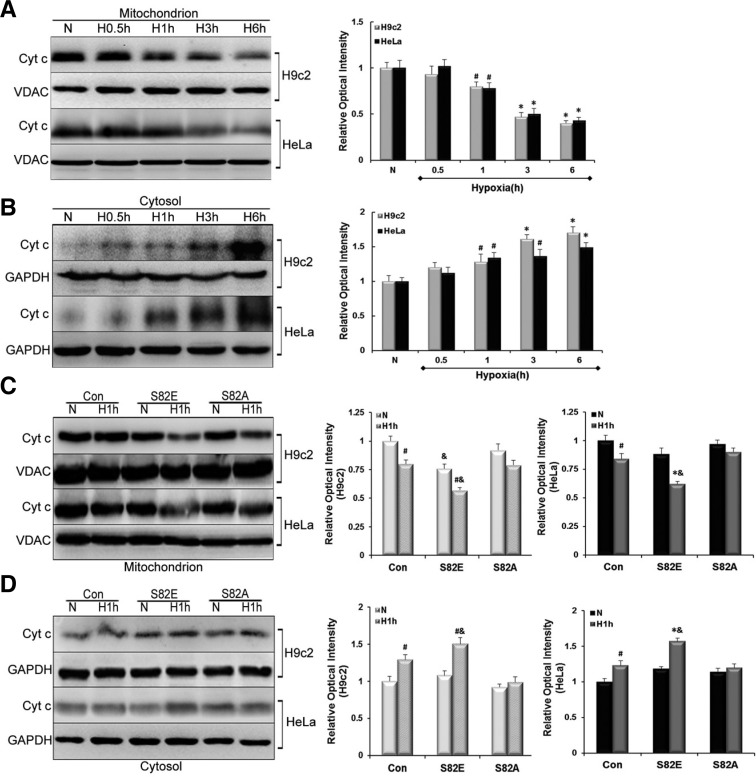
Fig. 6.
Influence of S82 mutants on Cyt c release of from mitochondria into cytosol. (A) and (B) exhibit the reverse change in Cyt c amounts in mitochondrial and cytosolic fractions: a gradual decrease vs. increase in H9c2 and HeLa cell lines. (C, D) show the effect of S82E and S82A mutants on Cyt c transfer in comparison with Con group under normoxia (N) and Hypoxia (H1h) condition in each cell line. Histograms to the right represent the quantified relative integrated signal of H9c2 and HeLa cells, respectively. Values are mean ± SEM (n = 3). #P < 0.05, *P < 0.01 vs. N; & P < 0.05 vs. Con.

