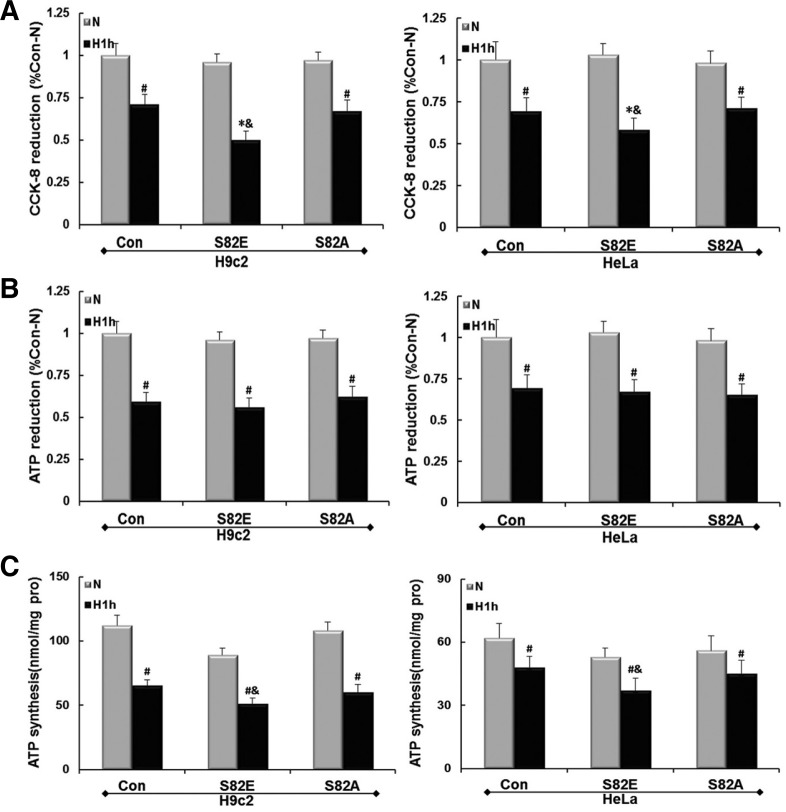
Fig. 7.
Cell viability and energy metabolism maintenance reduction in hypoxia. (A) shows a decrease in cell viability measured by CCK-8 method, and (B) shows a total ATP decrease respectively in H9c2 and Hela cell groups after Ad-S82E or Ad-S82A transfection. Values were normalized as percentages after comparison with N of Con. (first panel), set to 100%. (C) shows the ATP synthesis rates of different cell groups under the conditions as above. Values in the grpah are mean ± SEM (n = 3). #P < 0.05, *P < 0.01 vs. N; &P < 0.05 vs. Con.

