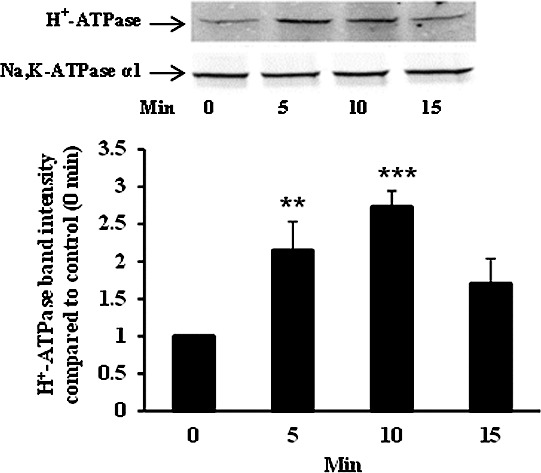
Figure 8.

Time course of the H+-ATPase (B1) increase detected in a plasma membrane-enriched preparation obtained from NPE cells exposed to 8-Br-cAMP (1 mM) for 5 to 15 minutes. A representative Western blot is shown (upper panel) together with a bar graph (lower panel) that shows band density results pooled from three independent experiments (mean ± SEM). Na,K-ATPase α1 was used as a housekeeping control. ***, **Significant difference from control at P < 0.01 and P > 0.05, respectively.
