
Figure 2.
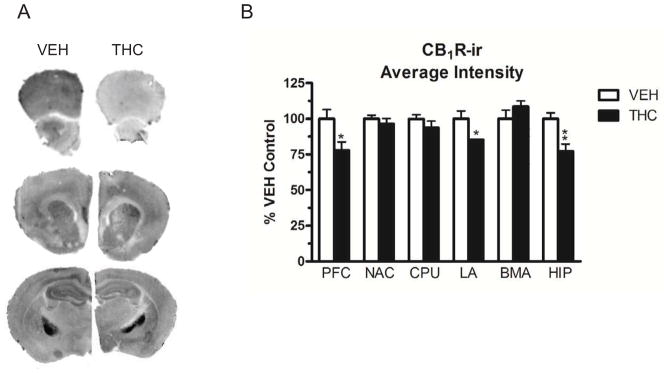
(A) Representative images of LI-COR scans for CB1R-ir. Prefrontal cortex is shown in row 1, nucleus accumbens and caudate-putamen in row 2, and hippocampus, lateral amygdala and basomedial amygdala in row 3. (B) Graph showing differences in average intensity for CB1R-ir as a percent of vehicle. Data are means ± SEM with * p < 0.05 versus vehicle controls, un-paired, two-tailed Student t-test, n = 8 mice per group.