
Figure 3.
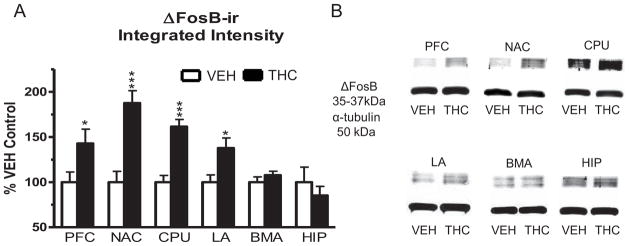
Immunoblot results for ΔFosB expression in the prefrontal cortex, nucleus accumbens, caudate-putamen, lateral amygdala, basomedial amygdala and hippocampus of mice that received repeated vehicle or THC administration. Blots were probed with antibodies directed against ΔFosB and α-tubulin (loading control). (A) Graph showing densitometric analysis of brain regions from vehicle- and THC-treated mice expressed as percent vehicle control. Data are means ± SEM with * p < 0.05 and *** p < 0.001 versus vehicle controls, un-paired, two-tailed student t-test, n = 8 per group. (B) Representative blots showing ΔFosB-ir and α-tubulin-ir in vehicle- and THC-treated brains for each region examined.