
Figure 4.
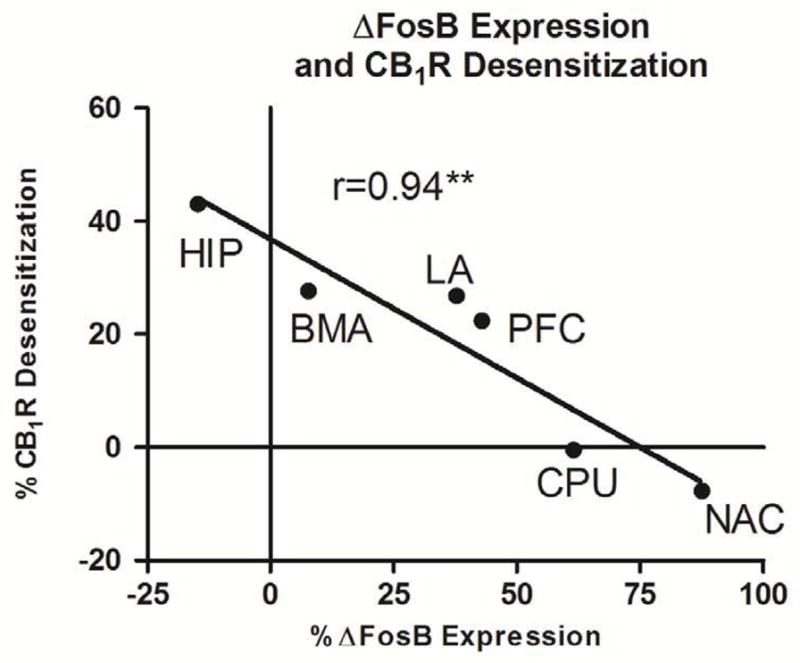
Correlation of percent change in measured parameters for THC-compared to vehicle-treated mice for the brain regions examined between desensitization (y-axis) and ΔFosB expression (x-axis). Correlation is presented as percent change from vehicle with corresponding r-squared values. Data are means ± SEM with ** p < 0.01, F-test, n=8 per group.