Figure 6.
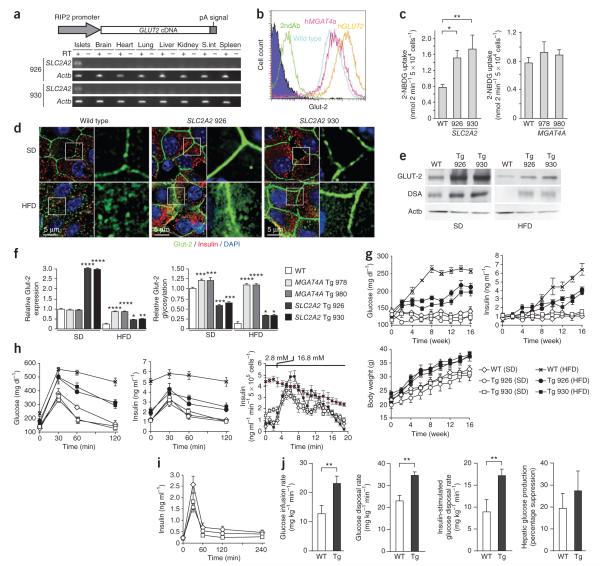
Enforced beta cell–specific expression of GnT-4a substrate GLUT-2 mitigates diet- and obesity-induced diabetes. (a) Human SLC2A2 cDNA was incorporated into a transgene vector that conferred beta cell–specific expression in multiple tissues of two separate founder lines, 926 and 930. (b) Beta cell surface expression of GLUT-2 analyzed by flow cytometry from WT, MGAT4A Tg (978), and SLC2A2 Tg (926) mice receiving standard diet (SD). (c) Glucose analog 2-NBDG transport into cultured islet cells isolated from WT mice and Tg littermates fed SD. (d) Pancreatic beta cell histology of WT and MGAT4A Tg littermates that received either SD or high-fat diet (HFD) for the preceding 10 weeks. Antibody binding and visualization of Glut-2 (green), insulin (red) and DNA (blue). (e) Islet cell Glut-2 and GLUT-2 immunoprecipitates were analyzed for Glut-2 abundance and DSA lectin binding from WT or SLC2A2 Tg littermates administered indicated dietary stimuli. Single analysis shown represents three independent experiments with different littermates. (f) Histogram of GLUT-2 protein abundance (left) and GLUT-2 glycosylation (right) was calculated from results in e. (g) Blood glucose (left), blood insulin (right) and body weight (bottom) were measured in unfasted mice every 2 weeks for up to 16 weeks of indicated diet administration. (h) In fasted mice that had received SD or HFD for 10 weeks, glucose tolerance tests measured blood glucose (left) and insulin release (middle). GSIS activity was analyzed ex vivo by perifusion (bottom) in islet cells isolated from mice that received either SD or HFD for preceding 4 weeks. Glucose concentration was increased from 2.8 mM to 16.8 mM at time indicated. Data from WT beta cells, red line. (i) Insulin secretion response to l-arginine injection in fasting WT and SLC2A2 Tg mice receiving SD. (j) Euglycemic and hyperinsulinemic clamp studies after 10 weeks on HFD compared measurements of glucose infusion rate, glucose disposal rate, insulin-stimulated glucose disposal rate and hepatic suppression of gluconeogenesis. The clamp studies included eight WT and eight SLC2A2 Tg littermates. Data plotted throughout are means ± s.e.m. At least six or seven mice including littermates were studied in each experiment unless otherwise stated. *P = 0.01–0.04; **P = 0.001–0.09; ***P = 0.0001–0.0009; ****P < 0.0001 (Student’s t test, c, f and g; single-tail t test, j).

